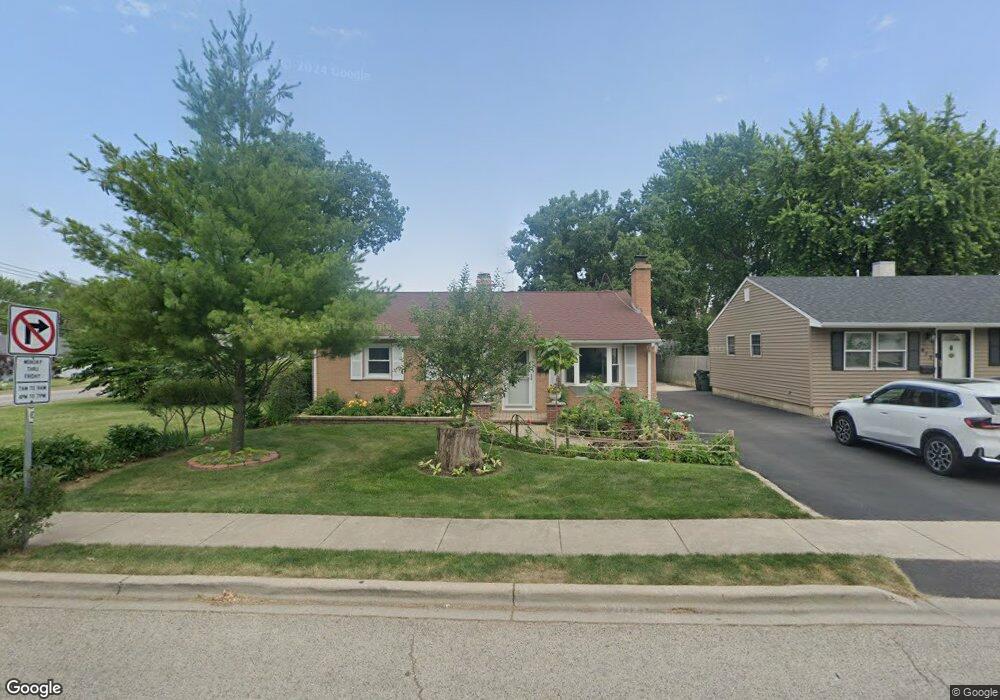
609 Longfellow Ln Mundelein, IL 60060
Estimated Value: $272,144 - $354,000
--
Bed
1
Bath
1,489
Sq Ft
$208/Sq Ft
Est. Value
About This Home
This home is located at 609 Longfellow Ln, Mundelein, IL 60060 and is currently estimated at $309,036, approximately $207 per square foot. 609 Longfellow Ln is a home located in Lake County with nearby schools including Hawthorn School Of Dual Language, Hawthorn Aspen Elementary School, and Hawthorn Middle School South.
Ownership History
Date
Name
Owned For
Owner Type
Purchase Details
Closed on
Jul 14, 2023
Sold by
Roman Salvador and Roman Melania
Bought by
Salvador And Melania Roman Revocable Living T and Roman
Current Estimated Value
Purchase Details
Closed on
Mar 11, 2003
Sold by
Roman Salvador and Villalobos Adan
Bought by
Roman Salvador
Home Financials for this Owner
Home Financials are based on the most recent Mortgage that was taken out on this home.
Original Mortgage
$136,800
Interest Rate
5.86%
Purchase Details
Closed on
Sep 6, 2000
Sold by
Kielgas William E and Kielgas Elaine M
Bought by
Roman Salvador and Villalobos Adan
Home Financials for this Owner
Home Financials are based on the most recent Mortgage that was taken out on this home.
Original Mortgage
$130,150
Interest Rate
8.14%
Create a Home Valuation Report for This Property
The Home Valuation Report is an in-depth analysis detailing your home's value as well as a comparison with similar homes in the area
Home Values in the Area
Average Home Value in this Area
Purchase History
| Date | Buyer | Sale Price | Title Company |
|---|---|---|---|
| Salvador And Melania Roman Revocable Living T | -- | None Listed On Document | |
| Roman Salvador | -- | Blackhawk Title Services | |
| Roman Salvador | $137,000 | Chicago Title Insurance Co |
Source: Public Records
Mortgage History
| Date | Status | Borrower | Loan Amount |
|---|---|---|---|
| Previous Owner | Roman Salvador | $136,800 | |
| Previous Owner | Roman Salvador | $130,150 |
Source: Public Records
Tax History Compared to Growth
Tax History
| Year | Tax Paid | Tax Assessment Tax Assessment Total Assessment is a certain percentage of the fair market value that is determined by local assessors to be the total taxable value of land and additions on the property. | Land | Improvement |
|---|---|---|---|---|
| 2024 | $5,897 | $84,620 | $18,875 | $65,745 |
| 2023 | $5,375 | $75,775 | $16,902 | $58,873 |
| 2022 | $5,375 | $64,991 | $16,246 | $48,745 |
| 2021 | $5,167 | $63,592 | $15,896 | $47,696 |
| 2020 | $4,769 | $59,546 | $14,885 | $44,661 |
| 2019 | $4,174 | $53,618 | $13,403 | $40,215 |
| 2018 | $3,324 | $42,714 | $9,232 | $33,482 |
| 2017 | $3,515 | $41,366 | $8,941 | $32,425 |
| 2016 | $3,356 | $39,220 | $8,477 | $30,743 |
| 2015 | $3,230 | $36,657 | $7,923 | $28,734 |
| 2014 | $4,108 | $36,165 | $7,817 | $28,348 |
| 2012 | $4,036 | $45,600 | $9,857 | $35,743 |
Source: Public Records
Map
Nearby Homes
- 425 S Lake St
- 130 Shadydell Ave
- 433 E High St
- 510 S Hickory St
- 640 Allanson Rd
- 114 W Hawthorne Blvd
- 207 Shady Ln
- 18 S Hawthorne Blvd
- 228 Woodlawn Dr
- 701 Thomas Ct
- 519 Jennifer Cir Unit 111
- 18804 W Hickory St
- 40 S Seymour Ave
- 18838 W Hickory St
- 49 N Shaddle Ave
- 1651 Pauline Cir Unit 1
- 1631 Pauline Cir Unit 3
- 1544 Lakeridge Ct
- 29746 U S 45
- 31 Washington Blvd Unit 108
- 613 Longfellow Ln
- 605 Longfellow Ln
- 617 Longfellow Ln
- 433 Allanson Rd
- 621 Longfellow Ln
- 18 Birch Ct
- 439 Allanson Rd
- 412 Allanson Rd
- 408 Allanson Rd
- 625 Longfellow Ln
- 420 Allanson Rd
- 323 Allanson Rd
- 24 Birch Ct
- 614 Longfellow Ln
- 342 Allanson Rd
- 618 Longfellow Ln
- 12 Birch Ct
- 430 Allanson Rd
- 701 Longfellow Ln
- 336 Allanson Rd