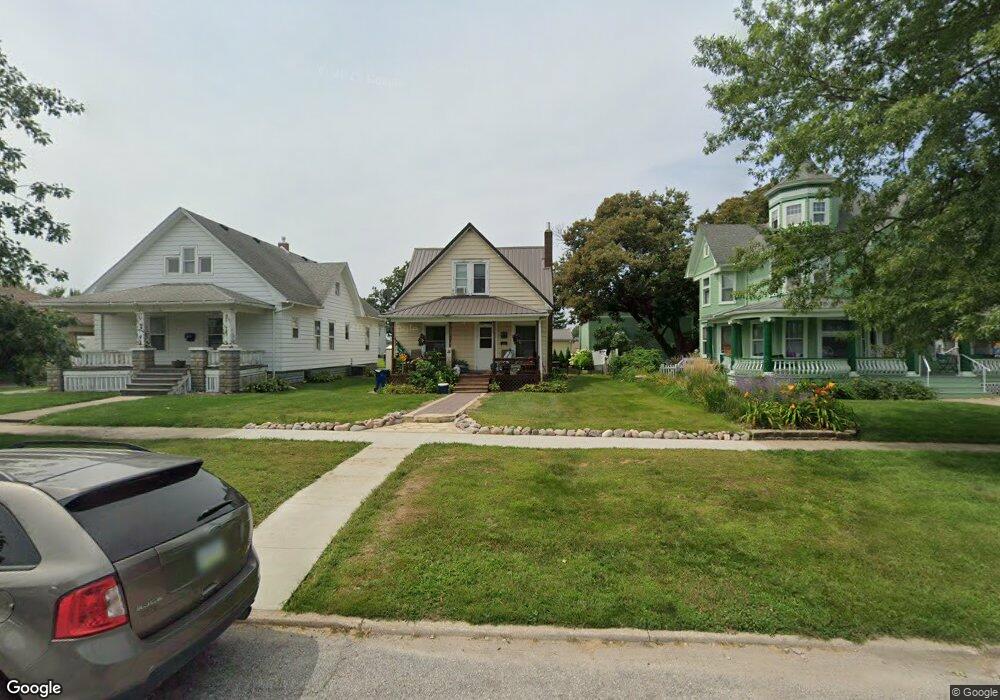
609 Mulberry St Tipton, IA 52772
Estimated Value: $149,000 - $161,000
3
Beds
1
Bath
1,236
Sq Ft
$124/Sq Ft
Est. Value
About This Home
This home is located at 609 Mulberry St, Tipton, IA 52772 and is currently estimated at $153,531, approximately $124 per square foot. 609 Mulberry St is a home located in Cedar County with nearby schools including Tipton Elementary School, Tipton Middle School, and Tipton High School.
Ownership History
Date
Name
Owned For
Owner Type
Purchase Details
Closed on
Feb 23, 2016
Sold by
Hermiston Benjame N
Bought by
Hermiston Lacy
Current Estimated Value
Purchase Details
Closed on
Apr 15, 2010
Sold by
Goetz Virginia J and Goetz Donald K
Bought by
Hermiston Lacy and Hermiston Benjamen
Home Financials for this Owner
Home Financials are based on the most recent Mortgage that was taken out on this home.
Original Mortgage
$44,000
Outstanding Balance
$29,091
Interest Rate
5.01%
Mortgage Type
New Conventional
Estimated Equity
$124,440
Create a Home Valuation Report for This Property
The Home Valuation Report is an in-depth analysis detailing your home's value as well as a comparison with similar homes in the area
Home Values in the Area
Average Home Value in this Area
Purchase History
| Date | Buyer | Sale Price | Title Company |
|---|---|---|---|
| Hermiston Lacy | -- | None Available | |
| Hermiston Lacy | $55,000 | None Available |
Source: Public Records
Mortgage History
| Date | Status | Borrower | Loan Amount |
|---|---|---|---|
| Open | Hermiston Lacy | $44,000 |
Source: Public Records
Tax History Compared to Growth
Tax History
| Year | Tax Paid | Tax Assessment Tax Assessment Total Assessment is a certain percentage of the fair market value that is determined by local assessors to be the total taxable value of land and additions on the property. | Land | Improvement |
|---|---|---|---|---|
| 2025 | $2,220 | $135,830 | $11,000 | $124,830 |
| 2024 | $2,220 | $123,340 | $11,000 | $112,340 |
| 2023 | $1,994 | $115,760 | $11,000 | $104,760 |
| 2022 | $1,798 | $91,380 | $9,000 | $82,380 |
| 2021 | $1,672 | $91,380 | $9,000 | $82,380 |
| 2020 | $1,574 | $86,800 | $9,000 | $77,800 |
| 2019 | $1,500 | $81,010 | $9,000 | $77,800 |
| 2018 | $1,432 | $79,640 | $0 | $0 |
| 2017 | $1,432 | $85,140 | $0 | $0 |
| 2016 | $1,568 | $85,140 | $0 | $0 |
| 2015 | $1,600 | $84,330 | $0 | $0 |
| 2014 | $1,572 | $84,330 | $0 | $0 |
Source: Public Records
Map
Nearby Homes
- 403 Walnut St
- 910 Meridian St
- 309 E 4th St
- 0 Lynn St
- 908 Lynn St
- 2 Lots E 5th St
- 105 Parkview Dr
- 111 W 11th St
- 4 Lot Parkview Ln
- 108 Parkview Ct
- 1007 Parkview Dr
- 10 Lots Parkview Dr
- 320 East St
- 511 W 8th St
- 506 W 9th St
- 9 Lot Parkview Ln
- 5 Lot Parkview Ln
- 3 Lot Parkview Ln
- 2 Lot Parkview Ln
- 6 Lot Parkview Ln