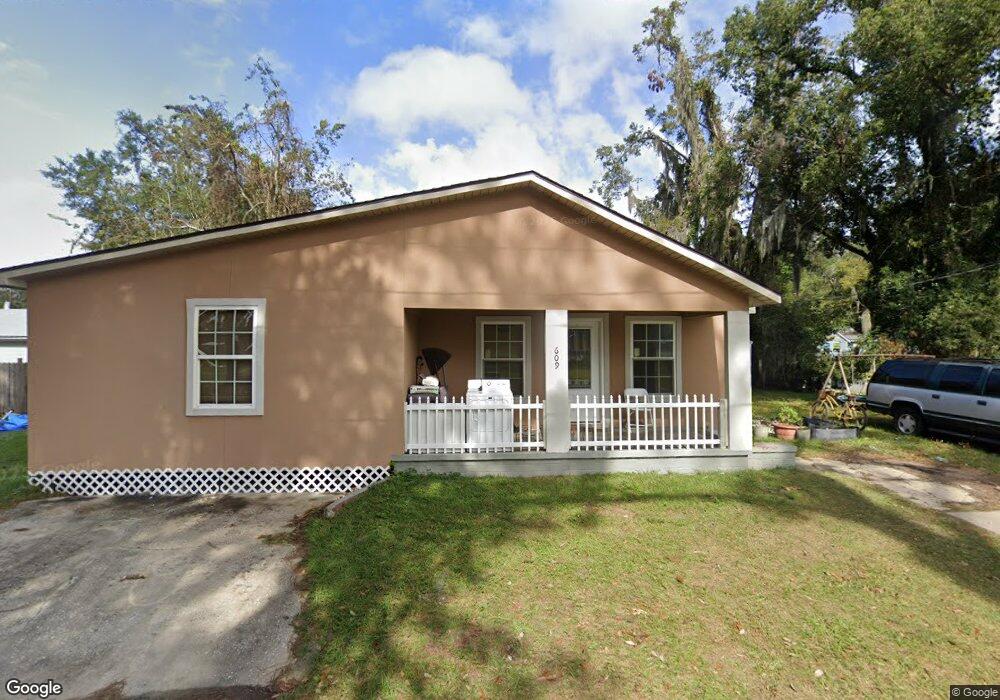
609 R St Brunswick, GA 31520
New Town NeighborhoodEstimated Value: $93,000 - $137,000
3
Beds
1
Bath
1,196
Sq Ft
$92/Sq Ft
Est. Value
About This Home
This home is located at 609 R St, Brunswick, GA 31520 and is currently estimated at $109,914, approximately $91 per square foot. 609 R St is a home located in Glynn County with nearby schools including Goodyear Elementary School, Risley Middle School, and Glynn Academy.
Ownership History
Date
Name
Owned For
Owner Type
Purchase Details
Closed on
Jun 15, 2018
Sold by
Brockington Jill M
Bought by
Bisoondath Sonny and Bisoondath Kaminie
Current Estimated Value
Purchase Details
Closed on
Jul 17, 2012
Sold by
Southeastern Bank
Bought by
Brockington Jill M
Purchase Details
Closed on
Jun 5, 2012
Sold by
Vigh Matthew
Bought by
Southeastern Bank
Purchase Details
Closed on
Mar 14, 2008
Sold by
Stewart Norman J
Bought by
Vigh Matthew
Create a Home Valuation Report for This Property
The Home Valuation Report is an in-depth analysis detailing your home's value as well as a comparison with similar homes in the area
Home Values in the Area
Average Home Value in this Area
Purchase History
| Date | Buyer | Sale Price | Title Company |
|---|---|---|---|
| Bisoondath Sonny | $90,000 | -- | |
| Brockington Jill M | -- | -- | |
| Southeastern Bank | -- | -- | |
| Vigh Matthew | $41,500 | -- |
Source: Public Records
Tax History Compared to Growth
Tax History
| Year | Tax Paid | Tax Assessment Tax Assessment Total Assessment is a certain percentage of the fair market value that is determined by local assessors to be the total taxable value of land and additions on the property. | Land | Improvement |
|---|---|---|---|---|
| 2025 | $641 | $30,480 | $2,800 | $27,680 |
| 2024 | $639 | $30,400 | $2,800 | $27,600 |
| 2023 | $1,394 | $30,400 | $2,800 | $27,600 |
| 2022 | $727 | $10,720 | $2,800 | $7,920 |
| 2021 | $696 | $10,720 | $2,800 | $7,920 |
| 2020 | $634 | $10,720 | $2,800 | $7,920 |
| 2019 | $172 | $7,760 | $2,800 | $4,960 |
| 2018 | $222 | $9,240 | $2,800 | $6,440 |
| 2017 | $600 | $9,240 | $2,800 | $6,440 |
| 2016 | $482 | $8,240 | $2,800 | $5,440 |
| 2015 | $460 | $8,240 | $2,800 | $5,440 |
| 2014 | $460 | $8,240 | $2,800 | $5,440 |
Source: Public Records
Map
Nearby Homes