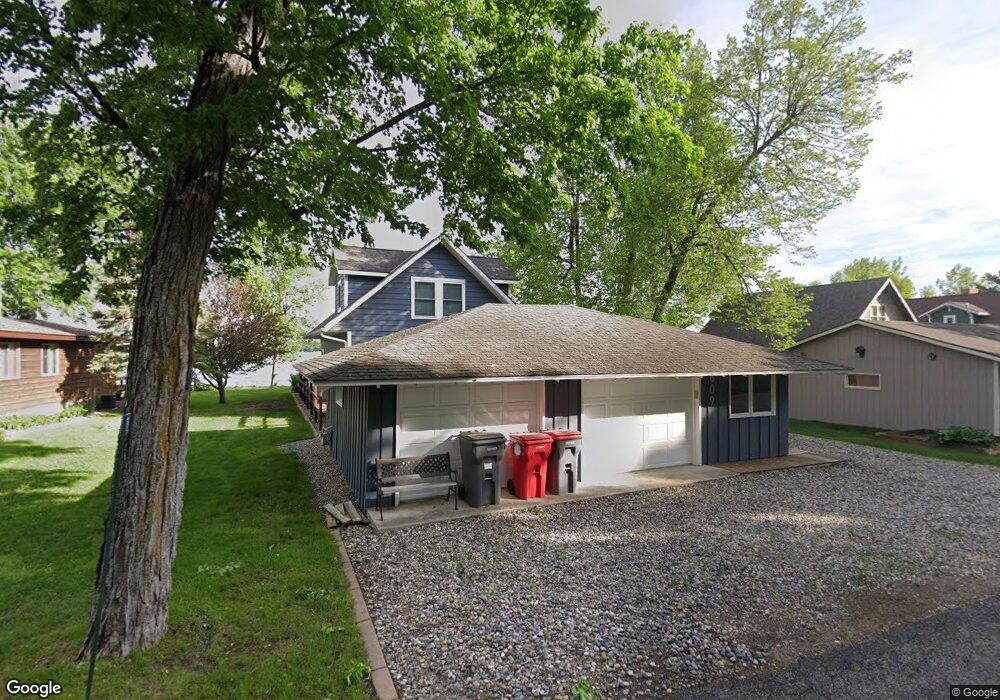
609 S Darling Ln NW Unit NW Alexandria, MN 56308
Estimated Value: $518,000 - $632,781
3
Beds
1
Bath
1,312
Sq Ft
$448/Sq Ft
Est. Value
About This Home
This home is located at 609 S Darling Ln NW Unit NW, Alexandria, MN 56308 and is currently estimated at $588,260, approximately $448 per square foot. 609 S Darling Ln NW Unit NW is a home located in Douglas County with nearby schools including Voyager Elementary School, Discovery Middle School, and Alexandria Area High School.
Ownership History
Date
Name
Owned For
Owner Type
Purchase Details
Closed on
Aug 3, 2018
Sold by
Drown Jeffrey J and Drown Jill M
Bought by
Petersen Amy L and Padavic James E
Current Estimated Value
Home Financials for this Owner
Home Financials are based on the most recent Mortgage that was taken out on this home.
Original Mortgage
$299,900
Outstanding Balance
$260,451
Interest Rate
4.5%
Mortgage Type
New Conventional
Estimated Equity
$327,809
Purchase Details
Closed on
Jun 10, 2005
Sold by
Lamusga Kaaren M and Lamusga David
Bought by
Drown Jeffrey J and Drown Jill M
Home Financials for this Owner
Home Financials are based on the most recent Mortgage that was taken out on this home.
Original Mortgage
$332,000
Interest Rate
5.91%
Mortgage Type
New Conventional
Create a Home Valuation Report for This Property
The Home Valuation Report is an in-depth analysis detailing your home's value as well as a comparison with similar homes in the area
Home Values in the Area
Average Home Value in this Area
Purchase History
| Date | Buyer | Sale Price | Title Company |
|---|---|---|---|
| Petersen Amy L | $449,900 | Douglas County Abstract Comp | |
| Drown Jeffrey J | $415,000 | None Available |
Source: Public Records
Mortgage History
| Date | Status | Borrower | Loan Amount |
|---|---|---|---|
| Open | Petersen Amy L | $299,900 | |
| Previous Owner | Drown Jeffrey J | $332,000 |
Source: Public Records
Tax History Compared to Growth
Tax History
| Year | Tax Paid | Tax Assessment Tax Assessment Total Assessment is a certain percentage of the fair market value that is determined by local assessors to be the total taxable value of land and additions on the property. | Land | Improvement |
|---|---|---|---|---|
| 2025 | $6,120 | $630,100 | $362,300 | $267,800 |
| 2024 | $6,120 | $605,300 | $346,500 | $258,800 |
| 2023 | $5,882 | $544,300 | $315,000 | $229,300 |
| 2022 | $5,292 | $523,000 | $313,500 | $209,500 |
| 2021 | $4,296 | $438,900 | $272,300 | $166,600 |
| 2020 | $4,412 | $417,100 | $264,000 | $153,100 |
| 2019 | $4,288 | $413,300 | $264,000 | $149,300 |
| 2018 | $4,156 | $388,000 | $247,000 | $141,000 |
| 2017 | $3,828 | $373,300 | $247,000 | $126,300 |
| 2016 | $4,064 | $344,544 | $225,525 | $119,019 |
| 2015 | $4,106 | $0 | $0 | $0 |
| 2014 | -- | $351,400 | $240,000 | $111,400 |
Source: Public Records
Map
Nearby Homes
- 4715 Dixie Ln SW
- 682-688 Voyager Dr
- 205 Ashley Ln
- 981 White Spruce Ln NW
- Lot 4 White Spruce Ln NW
- 2606 Sessions St NW
- 1268 Westbrook Cir
- 260 Voyager Dr
- 7826 unit 6 County Road 42 NE
- 7826 unit 8 County Road 42 NE
- 7826 unit 9 County Road 42 NE
- 7826 unit 3 County Road 42 NE
- 7826 unit 7 County Road 42 NE
- 3311 N Nokomis NE
- 3006 N Nokomis NE
- 676 Voyager Dr
- 1405 Steger Rd NW
- 1321 S Darling Dr NW
- 660 Voyager Dr
- 105 Ross Garden NW
- 607 S Darling Ln NW Unit NW
- 613 S Darling Ln NW Unit NW
- 2205 Ridgewood Dr NW
- 2207 Ridgewood Dr NW
- 703 S Darling Ln NW Unit NW
- 605 605 S Darling
- 605 S Darling Ln NW Unit NW
- 2203 Ridgewood Dr NW
- 705 S Darling Ln NW Unit NW
- 2209 Ridgewood Dr NW
- 707 S Darling Ln NW Unit NW
- 2201 Ridgewood Dr NW
- 2211 Ridgewood Dr NW
- 709 S Darling Ln NW Unit NW
- 595 S Darling Ln NW Unit NW
- 709 709 Darling-Lane-nw
- 2018 Autumn Dr NW
- 711 S Darling Ln NW Unit NW
- 2206 Ridgewood Dr NW