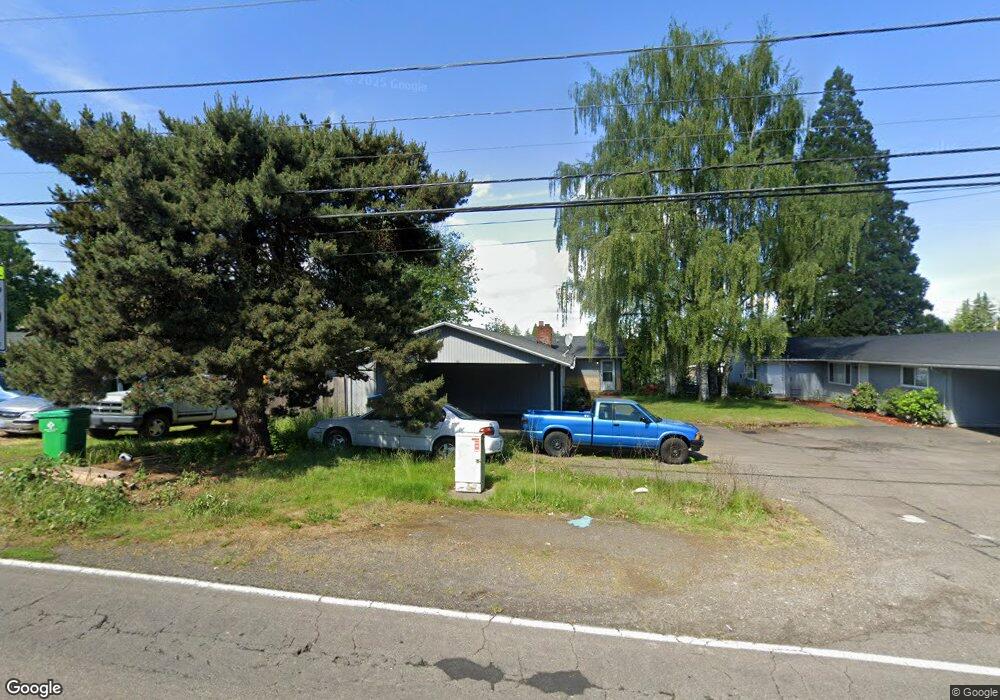
609 SE 212th Ave Unit 611 Gresham, OR 97030
North Central NeighborhoodEstimated Value: $414,000 - $455,000
4
Beds
2
Baths
1,728
Sq Ft
$254/Sq Ft
Est. Value
About This Home
This home is located at 609 SE 212th Ave Unit 611, Gresham, OR 97030 and is currently estimated at $439,594, approximately $254 per square foot. 609 SE 212th Ave Unit 611 is a home located in Multnomah County with nearby schools including North Gresham Elementary School, Clear Creek Middle School, and Gresham High School.
Ownership History
Date
Name
Owned For
Owner Type
Purchase Details
Closed on
Dec 16, 2024
Sold by
Morgan Trenton and Johnsen Jeffrey P
Bought by
Morgan Trenton and Morgan Rebecca
Current Estimated Value
Home Financials for this Owner
Home Financials are based on the most recent Mortgage that was taken out on this home.
Original Mortgage
$313,600
Outstanding Balance
$309,997
Interest Rate
6.79%
Mortgage Type
New Conventional
Estimated Equity
$129,597
Purchase Details
Closed on
Dec 5, 2022
Sold by
Hui Hui Family Trust
Bought by
Morgan Trenton and Johnsen Jeffrey P
Purchase Details
Closed on
Jun 3, 2011
Sold by
Siewell Juanita M
Bought by
Hui Tony B and Hui Luyen Thi Huynh
Purchase Details
Closed on
Jan 5, 2000
Sold by
Duvall Claude L
Bought by
Siewell Juanita M
Home Financials for this Owner
Home Financials are based on the most recent Mortgage that was taken out on this home.
Original Mortgage
$154,461
Interest Rate
7.72%
Mortgage Type
FHA
Create a Home Valuation Report for This Property
The Home Valuation Report is an in-depth analysis detailing your home's value as well as a comparison with similar homes in the area
Home Values in the Area
Average Home Value in this Area
Purchase History
| Date | Buyer | Sale Price | Title Company |
|---|---|---|---|
| Morgan Trenton | -- | Wfg Title | |
| Morgan Trenton | -- | Wfg Title | |
| Morgan Trenton | $320,000 | First American Title | |
| Hui Tony B | $130,300 | Chicago Title Company Oregon | |
| Siewell Juanita M | $156,500 | Fidelity National Title Co |
Source: Public Records
Mortgage History
| Date | Status | Borrower | Loan Amount |
|---|---|---|---|
| Open | Morgan Trenton | $313,600 | |
| Closed | Morgan Trenton | $313,600 | |
| Previous Owner | Siewell Juanita M | $154,461 |
Source: Public Records
Tax History
| Year | Tax Paid | Tax Assessment Tax Assessment Total Assessment is a certain percentage of the fair market value that is determined by local assessors to be the total taxable value of land and additions on the property. | Land | Improvement |
|---|---|---|---|---|
| 2025 | $4,618 | $226,920 | -- | -- |
| 2024 | $4,420 | $220,320 | -- | -- |
| 2023 | $4,027 | $213,910 | $0 | $0 |
| 2022 | $3,915 | $207,680 | $0 | $0 |
| 2021 | $3,816 | $201,640 | $0 | $0 |
| 2020 | $3,591 | $195,770 | $0 | $0 |
| 2019 | $3,497 | $190,070 | $0 | $0 |
| 2018 | $3,334 | $184,540 | $0 | $0 |
| 2017 | $3,199 | $179,170 | $0 | $0 |
| 2016 | $2,821 | $173,960 | $0 | $0 |
Source: Public Records
Map
Nearby Homes
- 21260 SE Stark St
- 21400 SE Stark St Unit 2
- 21016 SE Stark St Unit 71
- 21016 SE Stark St Unit 69
- 21001 SE Yamhill St
- 920 SE 214th Ave
- 21532 SE Alder St
- 209 SE 214th Ave
- 1026 SE 209th Ave
- 21525 SE Oak St
- 132 SE 214th Ave
- 21553 SE Ankeny Terrace
- 2013 NW Bella Vista Dr
- 1811 NW 19th St
- 1711 NW 19th St
- 1861 NW Wonderview Ave
- 522 SE 199th Ave
- 1035 SE 225th Ave
- 19776 SE Stark St Unit 147
- 0 SE Burnside St
- 615 SE 212th Ave
- 575 SE 212th Ave Unit 585
- 613 SE 212th Ave Unit 615
- 623 SE 212th Ave Unit 625
- 623 SE 212 Av(new Price)
- 633 SE 212th Ave Unit 635
- 21130 SE Stark St
- 548 SE 212th Ave
- 540 SE 212th Ave
- 701 SE 212th Ave Unit 705
- 610 SE 212th Ave
- 709 SE 212th Ave Unit 723
- 21318 SE Alder Ct Unit 21320
- 710 SE 212th Ave Unit 730
- 21309 SE Alder Ct Unit 21311
- 21326 SE Alder Ct Unit 21328
- 21121 SE Morrison St Unit 21133
- 21111 SE Morrison St Unit 21115
- 21400 SE Stark St Unit 6
- 21400 SE Stark St Unit 5
Your Personal Tour Guide
Ask me questions while you tour the home.