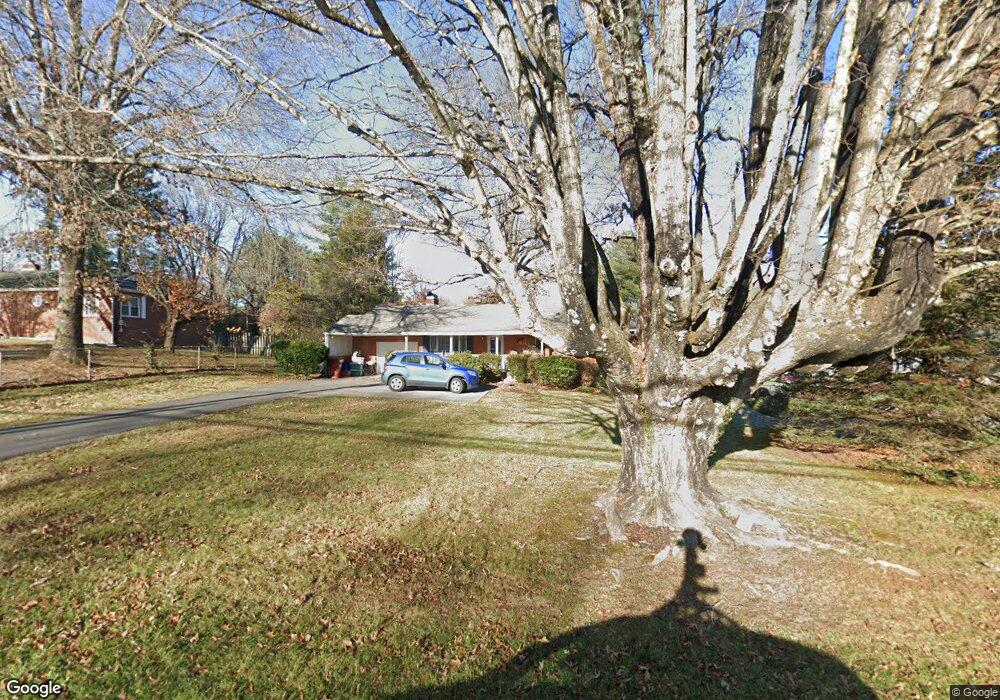
609 Swadley Rd Johnson City, TN 37601
Estimated Value: $278,000 - $307,000
3
Beds
2
Baths
1,476
Sq Ft
$195/Sq Ft
Est. Value
About This Home
This home is located at 609 Swadley Rd, Johnson City, TN 37601 and is currently estimated at $287,458, approximately $194 per square foot. 609 Swadley Rd is a home located in Washington County with nearby schools including Mountain View Elementary School, Liberty Bell Middle School, and Indian Trail Middle School.
Ownership History
Date
Name
Owned For
Owner Type
Purchase Details
Closed on
Aug 5, 2019
Sold by
Plummer Dana and Bowman Carolyn S
Bought by
Plummer Dana and Plummer Robert
Current Estimated Value
Purchase Details
Closed on
Sep 4, 2003
Sold by
Potter William and Potter Jacquelin
Bought by
Bowman Carolyn S
Home Financials for this Owner
Home Financials are based on the most recent Mortgage that was taken out on this home.
Original Mortgage
$100,700
Outstanding Balance
$48,759
Interest Rate
6.88%
Estimated Equity
$238,699
Purchase Details
Closed on
Nov 26, 1997
Sold by
Pruner Samuel T
Bought by
Potter William B and Potter Jacquel
Home Financials for this Owner
Home Financials are based on the most recent Mortgage that was taken out on this home.
Original Mortgage
$78,627
Interest Rate
7.19%
Purchase Details
Closed on
Jan 1, 1982
Bought by
Pruner Samuel T and Pruner Rubye V
Create a Home Valuation Report for This Property
The Home Valuation Report is an in-depth analysis detailing your home's value as well as a comparison with similar homes in the area
Home Values in the Area
Average Home Value in this Area
Purchase History
| Date | Buyer | Sale Price | Title Company |
|---|---|---|---|
| Plummer Dana | -- | None Available | |
| Bowman Carolyn S | $106,000 | -- | |
| Potter William B | $78,600 | -- | |
| Pruner Samuel T | $47,100 | -- |
Source: Public Records
Mortgage History
| Date | Status | Borrower | Loan Amount |
|---|---|---|---|
| Open | Pruner Samuel T | $100,700 | |
| Previous Owner | Pruner Samuel T | $78,627 |
Source: Public Records
Tax History Compared to Growth
Tax History
| Year | Tax Paid | Tax Assessment Tax Assessment Total Assessment is a certain percentage of the fair market value that is determined by local assessors to be the total taxable value of land and additions on the property. | Land | Improvement |
|---|---|---|---|---|
| 2024 | $1,122 | $65,600 | $9,150 | $56,450 |
| 2022 | $1,027 | $47,775 | $9,150 | $38,625 |
| 2021 | $1,854 | $47,775 | $9,150 | $38,625 |
| 2020 | $1,844 | $47,775 | $9,150 | $38,625 |
| 2019 | $920 | $47,775 | $9,150 | $38,625 |
| 2018 | $1,651 | $38,675 | $5,750 | $32,925 |
| 2017 | $1,651 | $38,675 | $5,750 | $32,925 |
| 2016 | $1,643 | $38,675 | $5,750 | $32,925 |
| 2015 | $1,489 | $38,675 | $5,750 | $32,925 |
| 2014 | $1,392 | $38,675 | $5,750 | $32,925 |
Source: Public Records
Map
Nearby Homes
- Tbd Swadley Rd
- 0000 Plymouth Rd
- 197 Woodland Dr
- 188 Arlington Dr
- 515 Pilgrim Ct Unit D
- 515 Pilgrim Ct Unit B
- 907 Cedar Grove Rd
- 518 Pilgrim Ct Unit D
- 506 Pilgrim Ct Unit B
- 504 Pilgrim Ct Unit D
- 9 Lynn Terrace Ct
- 500 Pilgrim Ct Unit B
- 805 E Maple St
- 1704 Orlando Dr
- 322 Preservation Cir
- 212 Mayflower Rd
- 1012 Kingston Ct
- 3303 Martin Farm Rd
- 126 Fairlawn Dr
- 300 Peach Blossom Ct
- 607 Swadley Rd
- 0 Swadley Rd
- TRCT3 Swadley Rd
- TRCT2 Swadley Rd
- 2605 Abbott Dr
- 2310 Abbott Dr
- 701 Swadley Rd
- 701 Swadley Rd Unit 2
- 701 Swadley Rd Unit 1
- 2311 Abbott Dr Unit 4
- 2311 Abbott Dr Unit 3
- 2311 Abbott Dr Unit 2
- 2311 Abbott Dr Unit 1
- Tbd Abbott Dr
- 0 S No Pone Valley Rd Unit 1122923
- 0 S No Pone Valley Rd Unit 1122925
- 0 S No Pone Valley Rd Unit 1137212
- 2308 Abbott Dr
- 610 Swadley Rd
- 608 Swadley Rd