Estimated Value: $1,320,000 - $1,783,000
3
Beds
2
Baths
1,690
Sq Ft
$867/Sq Ft
Est. Value
About This Home
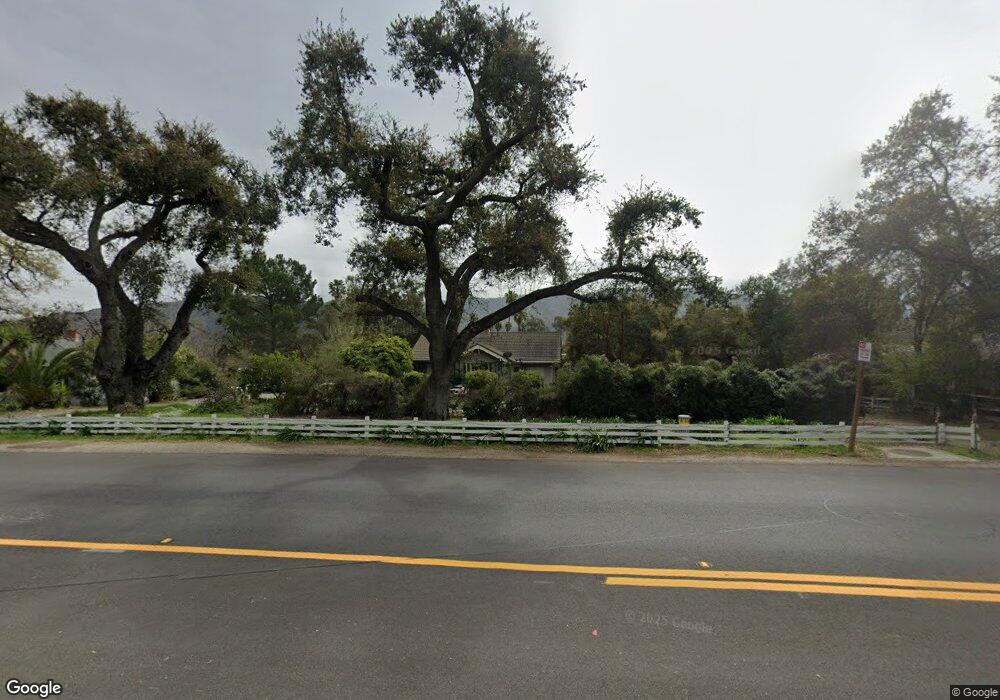
This home is located at 609 W Ojai Ave, Ojai, CA 93023 and is currently estimated at $1,465,682, approximately $867 per square foot. 609 W Ojai Ave is a home located in Ventura County with nearby schools including Topa Topa Elementary School, Matilija Junior High, and Legacy High School.
Ownership History
Date
Name
Owned For
Owner Type
Purchase Details
Closed on
Apr 1, 2020
Sold by
Switzer Jeffrey L and Switzer Debra L
Bought by
Switzer Jeffrey L and Switzer Debra L
Current Estimated Value
Purchase Details
Closed on
Apr 27, 1998
Sold by
Switzer Kenneth L and Switzer Marcelene
Bought by
Switzer Jeffrey L and Switzer Debra L
Purchase Details
Closed on
Dec 21, 1995
Sold by
Silkett Joe
Bought by
Switzer Jeffrey L and Switzer Debra L
Home Financials for this Owner
Home Financials are based on the most recent Mortgage that was taken out on this home.
Original Mortgage
$203,150
Outstanding Balance
$4,156
Interest Rate
7.37%
Mortgage Type
Purchase Money Mortgage
Estimated Equity
$1,461,526
Purchase Details
Closed on
Oct 16, 1995
Sold by
Great Western Bank
Bought by
Silkett Joel
Purchase Details
Closed on
Jun 6, 1995
Sold by
Switzer Kenneth L and Switzer Marcelene J
Bought by
Great Western Bank
Create a Home Valuation Report for This Property
The Home Valuation Report is an in-depth analysis detailing your home's value as well as a comparison with similar homes in the area
Home Values in the Area
Average Home Value in this Area
Purchase History
| Date | Buyer | Sale Price | Title Company |
|---|---|---|---|
| Switzer Jeffrey L | -- | None Available | |
| Switzer Jeffrey L | -- | First American Title Ins Co | |
| Switzer Jeffrey L | -- | Chicago Title Co | |
| Silkett Joel | $245,000 | Chicago Title Co | |
| Great Western Bank | $87,624 | United Title Company |
Source: Public Records
Mortgage History
| Date | Status | Borrower | Loan Amount |
|---|---|---|---|
| Open | Switzer Jeffrey L | $203,150 |
Source: Public Records
Tax History Compared to Growth
Tax History
| Year | Tax Paid | Tax Assessment Tax Assessment Total Assessment is a certain percentage of the fair market value that is determined by local assessors to be the total taxable value of land and additions on the property. | Land | Improvement |
|---|---|---|---|---|
| 2025 | $7,622 | $406,975 | $265,787 | $141,188 |
| 2024 | $7,622 | $398,996 | $260,576 | $138,420 |
| 2023 | $7,397 | $391,173 | $255,467 | $135,706 |
| 2022 | $7,298 | $383,503 | $250,457 | $133,046 |
| 2021 | $7,227 | $375,984 | $245,546 | $130,438 |
| 2020 | $7,066 | $372,130 | $243,029 | $129,101 |
| 2019 | $6,888 | $364,834 | $238,264 | $126,570 |
| 2018 | $6,803 | $357,682 | $233,593 | $124,089 |
| 2017 | $6,643 | $350,669 | $229,013 | $121,656 |
| 2016 | $4,948 | $343,794 | $224,523 | $119,271 |
| 2015 | $4,904 | $338,632 | $221,151 | $117,481 |
| 2014 | $4,274 | $332,001 | $216,820 | $115,181 |
Source: Public Records
Map
Nearby Homes
- 605 W Ojai Ave
- 603 W Ojai Ave
- 15724 California 150
- 1 San Antonio St
- 408 Country Club Dr Unit 2
- 410 Country Club Dr
- 414 Country Club Dr
- 2 San Antonio St
- 466 W Santa Ana St
- 444 W Santa Ana St
- 412 Topa Topa Dr
- 412 Topa Topa Dr
- 103 Bristol Rd
- 103 Bristol Rd
- 103 Bristol Rd Unit I
- 103 Bristol Rd Unit H
- 103 Bristol Rd Unit G
- 103 Bristol Rd Unit F
- 103 Bristol Rd Unit E
- 103 Bristol Rd Unit D