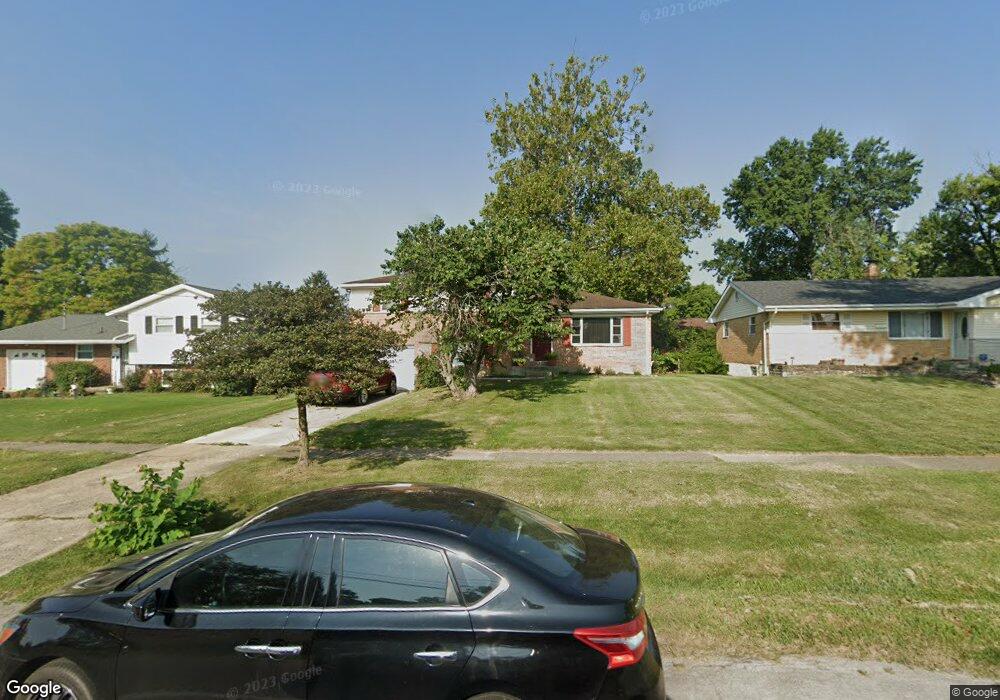
609 Waycross Rd Cincinnati, OH 45240
Estimated Value: $213,635 - $218,000
3
Beds
3
Baths
1,510
Sq Ft
$143/Sq Ft
Est. Value
About This Home
This home is located at 609 Waycross Rd, Cincinnati, OH 45240 and is currently estimated at $215,409, approximately $142 per square foot. 609 Waycross Rd is a home located in Hamilton County with nearby schools including Calvary Academy- The and St Gabriel Consolidated School.
Ownership History
Date
Name
Owned For
Owner Type
Purchase Details
Closed on
May 13, 2015
Sold by
Muddy River Homes Llc
Bought by
Vbpart Ii Borrower 1 Llc
Current Estimated Value
Purchase Details
Closed on
Aug 9, 2011
Sold by
Federal Home Loan Mortgage Corporation
Bought by
Muddy River Homes Llc
Purchase Details
Closed on
May 19, 2011
Sold by
Frion Jose L and Pena Rosa
Bought by
Federal Home Loan Mortgage Corporation
Purchase Details
Closed on
Jan 31, 2007
Sold by
Blakely John David and Blakely Judith Elaine
Bought by
Frion Jose L and Pena Rosa
Home Financials for this Owner
Home Financials are based on the most recent Mortgage that was taken out on this home.
Original Mortgage
$120,000
Interest Rate
6.22%
Mortgage Type
Unknown
Create a Home Valuation Report for This Property
The Home Valuation Report is an in-depth analysis detailing your home's value as well as a comparison with similar homes in the area
Home Values in the Area
Average Home Value in this Area
Purchase History
| Date | Buyer | Sale Price | Title Company |
|---|---|---|---|
| Vbpart Ii Borrower 1 Llc | -- | Attorney | |
| Muddy River Homes Llc | $49,000 | Attorney | |
| Federal Home Loan Mortgage Corporation | $66,000 | None Available | |
| Frion Jose L | $120,000 | Commitment Title Agency Inc |
Source: Public Records
Mortgage History
| Date | Status | Borrower | Loan Amount |
|---|---|---|---|
| Previous Owner | Frion Jose L | $120,000 |
Source: Public Records
Tax History
| Year | Tax Paid | Tax Assessment Tax Assessment Total Assessment is a certain percentage of the fair market value that is determined by local assessors to be the total taxable value of land and additions on the property. | Land | Improvement |
|---|---|---|---|---|
| 2025 | $3,152 | $52,087 | $9,282 | $42,805 |
| 2023 | $3,136 | $52,087 | $9,282 | $42,805 |
| 2022 | $2,964 | $37,349 | $8,257 | $29,092 |
| 2021 | $2,954 | $37,349 | $8,257 | $29,092 |
| 2020 | $2,917 | $37,349 | $8,257 | $29,092 |
| 2019 | $2,782 | $31,126 | $6,881 | $24,245 |
| 2018 | $2,786 | $31,126 | $6,881 | $24,245 |
| 2017 | $2,716 | $31,126 | $6,881 | $24,245 |
| 2016 | $1,543 | $17,150 | $7,644 | $9,506 |
| 2015 | $1,418 | $17,150 | $7,644 | $9,506 |
| 2014 | $1,311 | $17,150 | $7,644 | $9,506 |
| 2013 | $1,284 | $17,150 | $7,644 | $9,506 |
Source: Public Records
Map
Nearby Homes
- 564 Waycross Rd
- 602 Brightview Place Unit 34
- 612 Brightview Place Unit 30
- 614 Brightview Place Unit 29
- 626 Brightview Place Unit 24
- 622 Brightview Place Unit 26
- 620 Brightview Place Unit 27
- 624 Brightview Place Unit 25
- 483 Vista Glen Dr
- 162 Sheffield Rd
- 440 W Sharon Rd
- 38 Handel Ln
- 37 Hayden Dr
- 16 Japonica Dr
- 10483 Toulon Dr
- 1 Jennings Rd
- 1013 Ligorio Ave
- 34 Gambier Cir
- 920 Waycross Rd
- 31 Flanders Ln
- 611 Waycross Rd
- 607 Waycross Rd
- 617 Cascade Rd
- 615 Waycross Rd
- 603 Waycross Rd
- 613 Cascade Rd
- 619 Cascade Rd
- 621 Cascade Rd
- 611 Cascade Rd
- 601 Waycross Rd
- 617 Waycross Rd
- 608 Waycross Rd
- 612 Waycross Rd
- 625 Cascade Rd
- 609 Cascade Rd
- 616 Waycross Rd
- 619 Waycross Rd
- 599 Waycross Rd
- 627 Cascade Rd
- 605 Cascade Rd
Your Personal Tour Guide
Ask me questions while you tour the home.