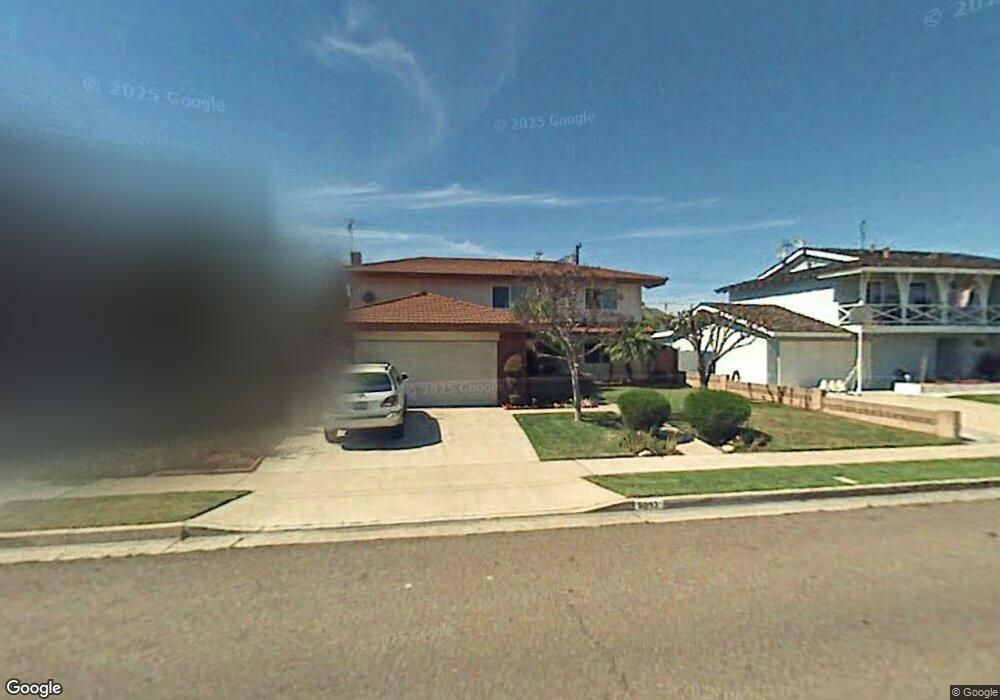
6093 Fred Dr Cypress, CA 90630
Estimated Value: $1,203,683 - $1,298,000
4
Beds
3
Baths
2,063
Sq Ft
$614/Sq Ft
Est. Value
About This Home
This home is located at 6093 Fred Dr, Cypress, CA 90630 and is currently estimated at $1,266,171, approximately $613 per square foot. 6093 Fred Dr is a home located in Orange County with nearby schools including Frank Vessels Elementary School, Lexington Junior High School, and Cypress High School.
Ownership History
Date
Name
Owned For
Owner Type
Purchase Details
Closed on
Jun 28, 2011
Sold by
Turpin Raymond and Turpin Juliette
Bought by
Turpin Raymond and Turpin Juliette
Current Estimated Value
Purchase Details
Closed on
Dec 1, 2005
Sold by
Turpin Raymond and Turpin Juliette
Bought by
Turpin Raymond and Turpin Juliette
Purchase Details
Closed on
Nov 18, 1998
Sold by
Winter Daniel D and Winter Leah O
Bought by
Turpin Raymond and Turpin Juliette
Home Financials for this Owner
Home Financials are based on the most recent Mortgage that was taken out on this home.
Original Mortgage
$227,150
Outstanding Balance
$50,585
Interest Rate
6.82%
Estimated Equity
$1,215,586
Create a Home Valuation Report for This Property
The Home Valuation Report is an in-depth analysis detailing your home's value as well as a comparison with similar homes in the area
Home Values in the Area
Average Home Value in this Area
Purchase History
| Date | Buyer | Sale Price | Title Company |
|---|---|---|---|
| Turpin Raymond | -- | Chicago Title | |
| Turpin Raymond | -- | Chicago Title | |
| Turpin Raymond | -- | -- | |
| Turpin Raymond | $284,500 | North American Title Co |
Source: Public Records
Mortgage History
| Date | Status | Borrower | Loan Amount |
|---|---|---|---|
| Open | Turpin Raymond | $227,150 | |
| Closed | Turpin Raymond | $28,450 |
Source: Public Records
Tax History
| Year | Tax Paid | Tax Assessment Tax Assessment Total Assessment is a certain percentage of the fair market value that is determined by local assessors to be the total taxable value of land and additions on the property. | Land | Improvement |
|---|---|---|---|---|
| 2025 | $5,064 | $446,002 | $304,945 | $141,057 |
| 2024 | $5,064 | $437,257 | $298,965 | $138,292 |
| 2023 | $4,946 | $428,684 | $293,103 | $135,581 |
| 2022 | $4,886 | $420,279 | $287,356 | $132,923 |
| 2021 | $4,821 | $412,039 | $281,722 | $130,317 |
| 2020 | $4,801 | $407,815 | $278,834 | $128,981 |
| 2019 | $4,667 | $399,819 | $273,367 | $126,452 |
| 2018 | $4,604 | $391,980 | $268,007 | $123,973 |
| 2017 | $4,446 | $384,295 | $262,752 | $121,543 |
| 2016 | $4,408 | $376,760 | $257,600 | $119,160 |
| 2015 | $4,374 | $371,101 | $253,730 | $117,371 |
| 2014 | $4,143 | $363,832 | $248,760 | $115,072 |
Source: Public Records
Map
Nearby Homes
- 6083 Fred Dr
- 9871 Sunny Cir
- 9948 Del Rio Way Unit 98
- 9786 Kathleen Dr
- 6344 Orange Ave
- 9806 Holder St
- 9332 Nancy St
- 8762 8764 La Salle
- 10460 Lorinda Ave
- 9826 Saint George Cir
- 6490 Carolina Cir
- 9031 Primavera Ln
- 5278 Hanover Dr
- 5442 Villa Way Unit 4
- 9302 Via Vista Dr
- 5197 Cumberland Dr
- 50 Lincoln Ct
- 3525 W Greentree Cir Unit G
- 10685 Lynn Cir
- 3580 W Sweetbay Ct Unit B
Your Personal Tour Guide
Ask me questions while you tour the home.