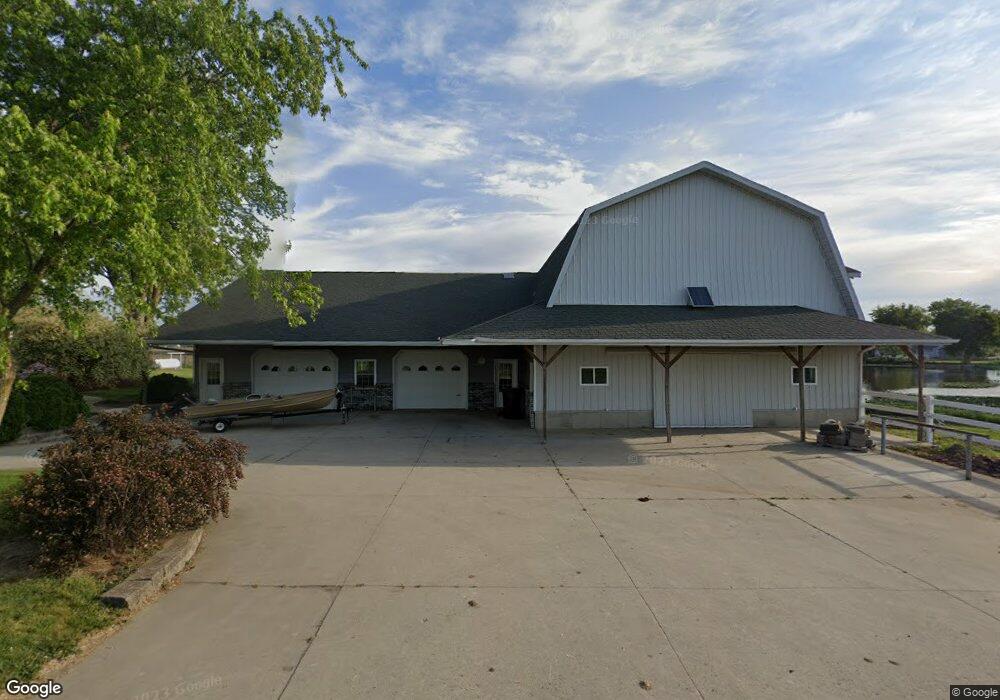
6095 W 300 S Topeka, IN 46571
Estimated Value: $292,000 - $642,000
4
Beds
1
Bath
2,024
Sq Ft
$197/Sq Ft
Est. Value
About This Home
This home is located at 6095 W 300 S, Topeka, IN 46571 and is currently estimated at $399,516, approximately $197 per square foot. 6095 W 300 S is a home located in LaGrange County with nearby schools including Shipshewana-Scott Elementary School, Westview Elementary School, and Westview Junior/Senior High School.
Ownership History
Date
Name
Owned For
Owner Type
Purchase Details
Closed on
Jul 6, 2022
Sold by
Bontrager and Laura
Bought by
Bontrager James L
Current Estimated Value
Home Financials for this Owner
Home Financials are based on the most recent Mortgage that was taken out on this home.
Original Mortgage
$517,500
Outstanding Balance
$491,433
Interest Rate
4.88%
Mortgage Type
New Conventional
Estimated Equity
-$91,917
Purchase Details
Closed on
Mar 14, 2013
Sold by
John Kevin Yoder
Bought by
Tri-County Land Trustee Corp
Create a Home Valuation Report for This Property
The Home Valuation Report is an in-depth analysis detailing your home's value as well as a comparison with similar homes in the area
Home Values in the Area
Average Home Value in this Area
Purchase History
| Date | Buyer | Sale Price | Title Company |
|---|---|---|---|
| Bontrager James L | $229,000 | Ebergard Weimer & Glick Pc | |
| Tri-County Land Trustee Corp | $270,000 | Tri County Land Trustee Corp |
Source: Public Records
Mortgage History
| Date | Status | Borrower | Loan Amount |
|---|---|---|---|
| Open | Bontrager James L | $517,500 |
Source: Public Records
Tax History Compared to Growth
Tax History
| Year | Tax Paid | Tax Assessment Tax Assessment Total Assessment is a certain percentage of the fair market value that is determined by local assessors to be the total taxable value of land and additions on the property. | Land | Improvement |
|---|---|---|---|---|
| 2024 | $1,718 | $279,400 | $72,200 | $207,200 |
| 2023 | $1,624 | $273,100 | $70,100 | $203,000 |
| 2022 | $1,576 | $256,400 | $65,700 | $190,700 |
| 2021 | $1,555 | $242,400 | $62,600 | $179,800 |
| 2020 | $1,506 | $231,200 | $61,800 | $169,400 |
| 2019 | $1,480 | $227,100 | $61,800 | $165,300 |
| 2018 | $1,538 | $229,300 | $61,800 | $167,500 |
| 2017 | $1,337 | $200,300 | $61,800 | $138,500 |
| 2016 | $1,315 | $196,200 | $61,800 | $134,400 |
| 2014 | $1,028 | $164,800 | $29,600 | $135,200 |
| 2013 | $1,028 | $161,700 | $29,600 | $132,100 |
Source: Public Records
Map
Nearby Homes
- 522 N Main St
- 310 Todd St
- 429 Jay St
- 423 Jay St
- 218 N Main St
- 317 E Lake St
- 217 Zook St
- 885 W 590 S
- 5755 S 075 W
- 6240 S 085 W
- Lot 4 W 610 S
- 365 Country Ln
- 7260 W 350 N
- 245 E 100 S
- 1575 W 195 N
- 7820 W 350 N
- 0 Corner of Factory St & Townline Rd Unit 202541800
- 217 N Sherman St
- 914 S Detroit St
- 207 S Poplar St