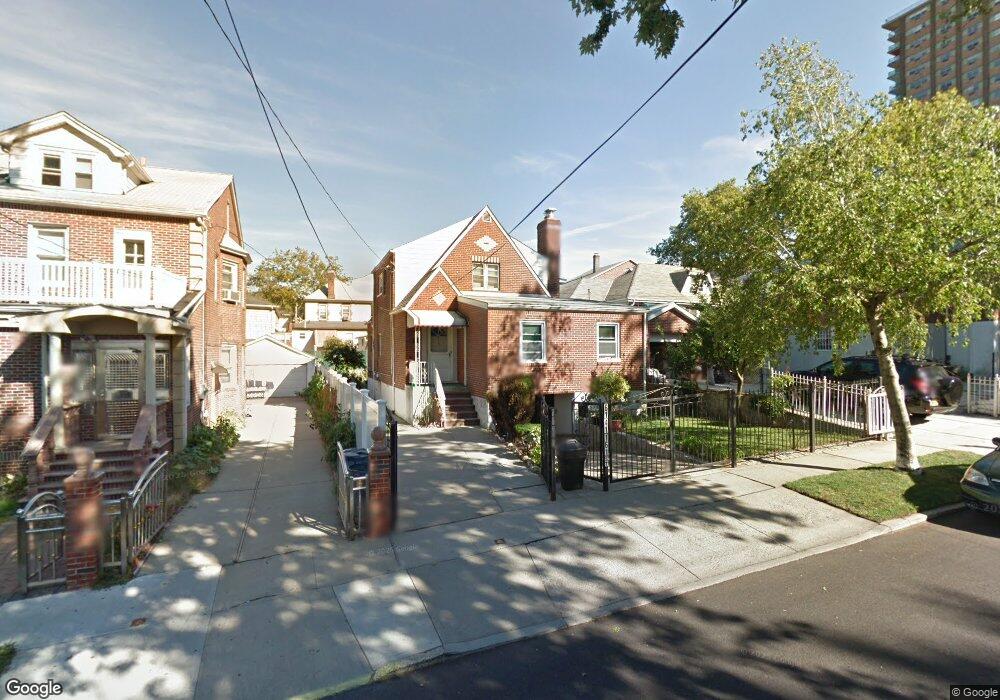
61-41 161st St Fresh Meadows, NY 11365
Pomonok NeighborhoodEstimated Value: $1,483,000 - $2,242,918
4
Beds
3
Baths
2,062
Sq Ft
$963/Sq Ft
Est. Value
About This Home
This home is located at 61-41 161st St, Fresh Meadows, NY 11365 and is currently estimated at $1,984,980, approximately $962 per square foot. 61-41 161st St is a home located in Queens County with nearby schools including P.S. 201 - The Discovery School for Inquiry & Research, Rachel Carson I.S. 237Q, and Solomon Schechter School of Queens.
Ownership History
Date
Name
Owned For
Owner Type
Purchase Details
Closed on
Oct 30, 2024
Sold by
6141 Realty Llc
Bought by
Lin Bi Yong
Current Estimated Value
Home Financials for this Owner
Home Financials are based on the most recent Mortgage that was taken out on this home.
Original Mortgage
$880,000
Outstanding Balance
$869,433
Interest Rate
6.12%
Mortgage Type
Purchase Money Mortgage
Estimated Equity
$1,115,547
Purchase Details
Closed on
Jul 6, 2021
Sold by
Cervoni Angelo
Bought by
Anthony Cervoni Trustee and Cervoni Family Irrevocable Trust 2021
Purchase Details
Closed on
Feb 28, 2017
Sold by
Casale Angela and Cervoni Angelo
Bought by
Cevoni Angelo
Purchase Details
Closed on
Apr 8, 2009
Sold by
Cervoni Angelo and Cervoni Anoinette
Bought by
Casale Angela and Cervoni Angelo
Create a Home Valuation Report for This Property
The Home Valuation Report is an in-depth analysis detailing your home's value as well as a comparison with similar homes in the area
Home Values in the Area
Average Home Value in this Area
Purchase History
| Date | Buyer | Sale Price | Title Company |
|---|---|---|---|
| Lin Bi Yong | $2,189,237 | -- | |
| Lin Bi Yong | $2,189,237 | -- | |
| Anthony Cervoni Trustee | -- | -- | |
| Anthony Cervoni Trustee | -- | -- | |
| Anthony Cervoni Trustee | -- | -- | |
| Cevoni Angelo | -- | -- | |
| Cevoni Angelo | -- | -- | |
| Cevoni Angelo | -- | -- | |
| Casale Angela | -- | -- | |
| Casale Angela | -- | -- |
Source: Public Records
Mortgage History
| Date | Status | Borrower | Loan Amount |
|---|---|---|---|
| Open | Lin Bi Yong | $880,000 | |
| Closed | Lin Bi Yong | $880,000 |
Source: Public Records
Tax History Compared to Growth
Tax History
| Year | Tax Paid | Tax Assessment Tax Assessment Total Assessment is a certain percentage of the fair market value that is determined by local assessors to be the total taxable value of land and additions on the property. | Land | Improvement |
|---|---|---|---|---|
| 2025 | $9,396 | $49,585 | $12,556 | $37,029 |
| 2024 | $9,396 | $46,780 | $12,523 | $34,257 |
| 2023 | $9,177 | $45,187 | $12,106 | $33,081 |
| 2022 | $4,527 | $77,400 | $19,740 | $57,660 |
| 2021 | $4,609 | $70,620 | $19,740 | $50,880 |
| 2020 | $8,746 | $77,640 | $19,740 | $57,900 |
| 2019 | $4,077 | $72,240 | $19,740 | $52,500 |
| 2018 | $3,838 | $37,656 | $14,256 | $23,400 |
| 2017 | $7,574 | $37,156 | $14,467 | $22,689 |
| 2016 | $7,297 | $37,156 | $14,467 | $22,689 |
| 2015 | $4,008 | $34,434 | $14,273 | $20,161 |
| 2014 | $4,008 | $32,486 | $16,155 | $16,331 |
Source: Public Records
Map
Nearby Homes
- 16216 65th Ave
- 6126 164th St
- 61-26 160th St
- 59-32 164th St
- 5944 159th St
- 6133 157th St
- 159-08 59th Ave
- 65-26 167th St
- 156-14 65th Ave
- 16604 67th Ave
- 65-47 167th St
- 6547 167th St
- 160-12 Booth Memorial Ave
- 57-12 164th St
- 166-03 69th Ave
- 57-19 Parsons Blvd
- 154-39 64th Ave
- 5728 Parsons Blvd Unit Front
- 6532 170th St
- 16511 Jewel Ave
- 6141 161st St
- 6137 161st St
- 6131 161st St
- 16103 65th Ave
- 16107 65th Ave
- 61-31 161st St Unit Fl 1
- 61-31 161st St
- 16111 65th Ave
- 6140 162nd St
- 16111 65th Ave Unit 2nd Fl
- 16111 65th Ave
- 16111 65th Ave
- 16111 65th Ave
- 6136 162nd St
- 6127 161st St Unit 1Fl
- 6127 161st St Unit 1Fl
- 6146 162nd St
- 61-46 162nd St Unit 3rd Floor
- 61-46 162nd St Unit 2F
- 6146 162nd St Unit 2F