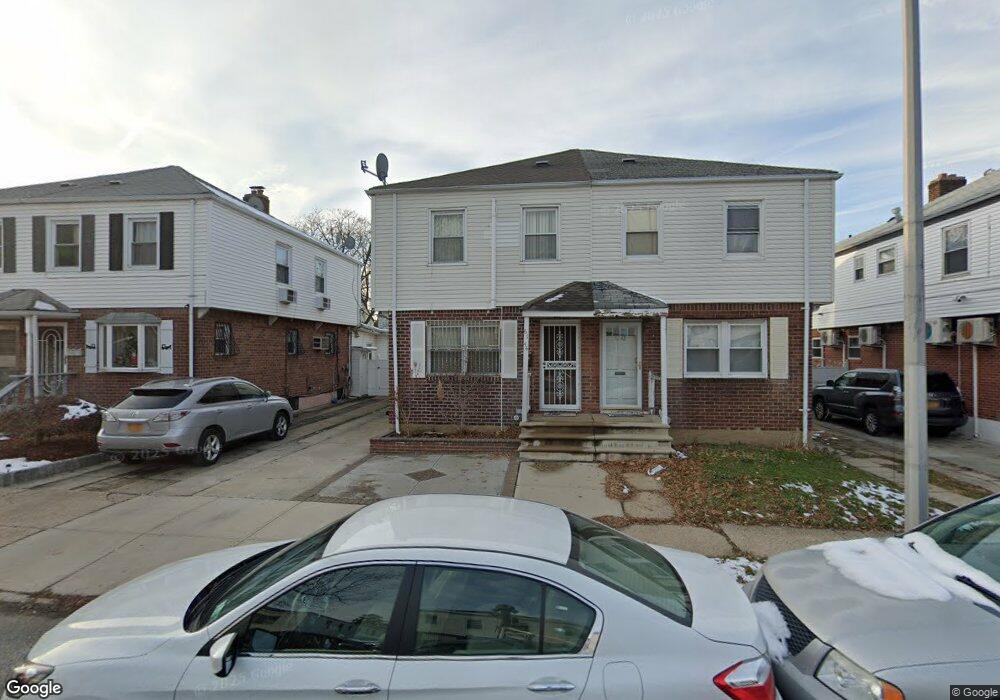
61-44 148th Place Flushing, NY 11367
Flushing NeighborhoodEstimated Value: $848,609 - $1,048,000
3
Beds
2
Baths
1,056
Sq Ft
$907/Sq Ft
Est. Value
About This Home
This home is located at 61-44 148th Place, Flushing, NY 11367 and is currently estimated at $957,652, approximately $906 per square foot. 61-44 148th Place is a home located in Queens County with nearby schools including I.S. 250 - The Robert F. Kennedy Community Middle School, John Bowne High School, and Yeshiva Of Central Queens.
Ownership History
Date
Name
Owned For
Owner Type
Purchase Details
Closed on
Aug 15, 2012
Sold by
Garcia Jorge A and Garcia Melanie
Bought by
Chen Pingrong and Xiao Lizhen
Current Estimated Value
Home Financials for this Owner
Home Financials are based on the most recent Mortgage that was taken out on this home.
Original Mortgage
$260,000
Outstanding Balance
$179,182
Interest Rate
3.56%
Mortgage Type
New Conventional
Estimated Equity
$778,470
Purchase Details
Closed on
Dec 3, 2003
Sold by
Park Maryan and Park Shee Hwan
Bought by
Garcia Jorge A and Garcia Melanie
Home Financials for this Owner
Home Financials are based on the most recent Mortgage that was taken out on this home.
Original Mortgage
$200,000
Interest Rate
5.67%
Mortgage Type
Purchase Money Mortgage
Purchase Details
Closed on
Aug 19, 1999
Sold by
Perret Lydia
Bought by
Park Maryan and Park Shee Hwan
Home Financials for this Owner
Home Financials are based on the most recent Mortgage that was taken out on this home.
Original Mortgage
$166,000
Interest Rate
7.83%
Create a Home Valuation Report for This Property
The Home Valuation Report is an in-depth analysis detailing your home's value as well as a comparison with similar homes in the area
Home Values in the Area
Average Home Value in this Area
Purchase History
| Date | Buyer | Sale Price | Title Company |
|---|---|---|---|
| Chen Pingrong | $525,000 | -- | |
| Garcia Jorge A | $400,000 | -- | |
| Park Maryan | $207,500 | Fidelity National Title Ins |
Source: Public Records
Mortgage History
| Date | Status | Borrower | Loan Amount |
|---|---|---|---|
| Open | Chen Pingrong | $260,000 | |
| Previous Owner | Garcia Jorge A | $200,000 | |
| Previous Owner | Park Maryan | $166,000 |
Source: Public Records
Tax History Compared to Growth
Tax History
| Year | Tax Paid | Tax Assessment Tax Assessment Total Assessment is a certain percentage of the fair market value that is determined by local assessors to be the total taxable value of land and additions on the property. | Land | Improvement |
|---|---|---|---|---|
| 2025 | $7,397 | $38,616 | $11,407 | $27,209 |
| 2024 | $7,397 | $36,826 | $10,225 | $26,601 |
| 2023 | $7,140 | $35,550 | $9,538 | $26,012 |
| 2022 | $7,097 | $52,260 | $13,860 | $38,400 |
| 2021 | $7,178 | $55,920 | $13,860 | $42,060 |
| 2020 | $6,812 | $54,900 | $13,860 | $41,040 |
| 2019 | $6,420 | $53,700 | $13,860 | $39,840 |
| 2018 | $6,039 | $29,625 | $10,496 | $19,129 |
| 2017 | $6,039 | $29,625 | $9,903 | $19,722 |
| 2016 | $5,682 | $29,625 | $9,903 | $19,722 |
| 2015 | $3,151 | $26,817 | $11,429 | $15,388 |
| 2014 | $3,151 | $25,574 | $11,994 | $13,580 |
Source: Public Records
Map
Nearby Homes
- 148-40 61st Rd
- 148-03 Horace Harding Expy
- 14850 60th Ave
- 150-01 Horace Harding Expy
- 150-12 59th Ave
- 150-40 60th Ave
- 138-65 63rd Ave
- 61-12 Main St
- 58-33 150th St
- 58-13 150th St
- 153-51 Horace Harding Expy
- 15308 58th Rd
- 5707 146th St
- 63-05 138th St
- 63-09 138th St
- 150-30 Booth Memorial Ave
- 144-60 Gravett Rd Unit 6F
- 144-60 Gravett Rd Unit 1C
- 144-60 Gravett Rd Unit 4J
- 66-10 149 St Unit 1F
- 6144 148th Place
- 6142 148th Place
- 6148 148th Place
- 6140 148th Place
- 61-40 148th Place Unit 1
- 61-40 148th Place
- 6150 148th Place
- 6138 148th Place
- 6152 148th Place Unit 2nd Floor
- 6152 148th Place
- 61-52 148th Place
- 6152 148th Place Unit 2nd Fl
- 61-52 148th Place Unit 2nd Fl
- 6143 148th St
- 6141 148th St
- 6147 148th St
- 6139 148th St
- 6154 148th Place
- 6149 148th St
- 61-43 148th St Unit 2