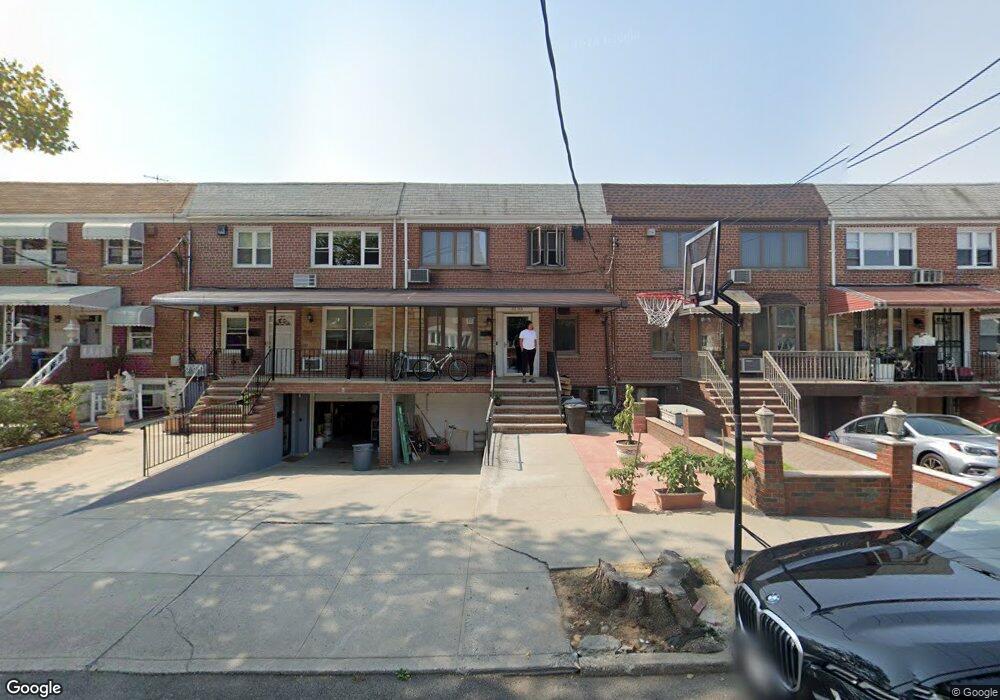
61-66 70th St Flushing, NY 11379
Middle Village NeighborhoodEstimated Value: $1,230,073 - $1,332,000
--
Bed
3
Baths
2,070
Sq Ft
$626/Sq Ft
Est. Value
About This Home
This home is located at 61-66 70th St, Flushing, NY 11379 and is currently estimated at $1,295,768, approximately $625 per square foot. 61-66 70th St is a home located in Queens County with nearby schools including P.S. 128 The Lorraine Tuzzo, Juniper Valley Elementary School, Grover Cleveland High School, and Our Lady Of Hope Elementary School.
Ownership History
Date
Name
Owned For
Owner Type
Purchase Details
Closed on
May 28, 2025
Sold by
Fang Lan Zhen and Fang Yuanfeng
Bought by
Fang Lan Zhen
Current Estimated Value
Purchase Details
Closed on
Mar 18, 2019
Sold by
Estate Of Lillian Pivovarsky and Pivovarsky George J
Bought by
Fang Lan Zhen and Fang Yuanfeng
Home Financials for this Owner
Home Financials are based on the most recent Mortgage that was taken out on this home.
Original Mortgage
$655,000
Outstanding Balance
$575,856
Interest Rate
4.4%
Mortgage Type
New Conventional
Estimated Equity
$719,912
Create a Home Valuation Report for This Property
The Home Valuation Report is an in-depth analysis detailing your home's value as well as a comparison with similar homes in the area
Home Values in the Area
Average Home Value in this Area
Purchase History
| Date | Buyer | Sale Price | Title Company |
|---|---|---|---|
| Fang Lan Zhen | -- | -- | |
| Fang Lan Zhen | $1,048,800 | -- |
Source: Public Records
Mortgage History
| Date | Status | Borrower | Loan Amount |
|---|---|---|---|
| Open | Fang Lan Zhen | $655,000 |
Source: Public Records
Tax History Compared to Growth
Tax History
| Year | Tax Paid | Tax Assessment Tax Assessment Total Assessment is a certain percentage of the fair market value that is determined by local assessors to be the total taxable value of land and additions on the property. | Land | Improvement |
|---|---|---|---|---|
| 2025 | $11,451 | $60,432 | $17,364 | $43,068 |
| 2024 | $11,451 | $57,011 | $17,451 | $39,560 |
| 2023 | $10,803 | $53,784 | $15,707 | $38,077 |
| 2022 | $10,332 | $67,500 | $21,360 | $46,140 |
| 2021 | $10,892 | $69,960 | $21,360 | $48,600 |
| 2020 | $10,660 | $66,960 | $21,360 | $45,600 |
| 2019 | -- | $63,660 | $21,360 | $42,300 |
| 2018 | $3,420 | $44,820 | $21,360 | $23,460 |
| 2016 | $3,398 | $43,130 | $18,956 | $24,174 |
Source: Public Records
Map
Nearby Homes