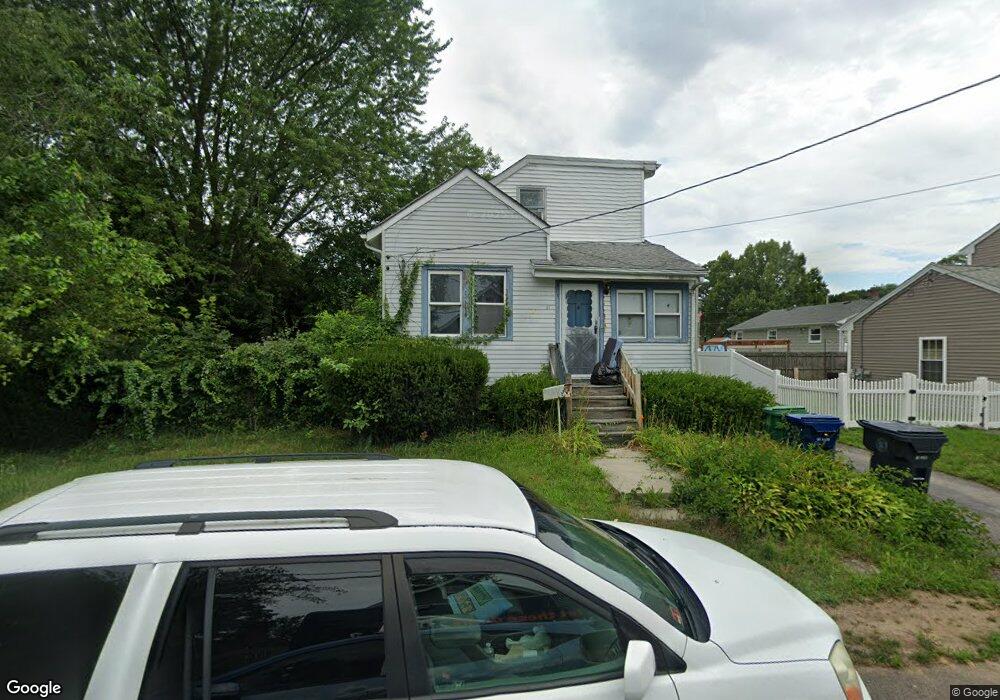
61 Belt St Warwick, RI 02889
Long Meadow NeighborhoodEstimated Value: $339,110 - $372,000
2
Beds
2
Baths
1,080
Sq Ft
$330/Sq Ft
Est. Value
About This Home
This home is located at 61 Belt St, Warwick, RI 02889 and is currently estimated at $356,528, approximately $330 per square foot. 61 Belt St is a home located in Kent County with nearby schools including Saint Kevin School and Bishop Hendricken High School.
Ownership History
Date
Name
Owned For
Owner Type
Purchase Details
Closed on
Mar 13, 2015
Sold by
Gedick Pamela A and Warwick City Of
Bought by
Gedick Pamela A
Current Estimated Value
Purchase Details
Closed on
Jul 13, 2004
Sold by
Carvalho Marie H
Bought by
Gedick Pamela A
Purchase Details
Closed on
Mar 29, 1996
Sold by
Andersen Stephen W and Andersen Paula
Bought by
Nadeau Steven L and Nadeau Marie
Create a Home Valuation Report for This Property
The Home Valuation Report is an in-depth analysis detailing your home's value as well as a comparison with similar homes in the area
Home Values in the Area
Average Home Value in this Area
Purchase History
| Date | Buyer | Sale Price | Title Company |
|---|---|---|---|
| Gedick Pamela A | $1,844 | -- | |
| Gedick Pamela A | $188,000 | -- | |
| Nadeau Steven L | $63,500 | -- |
Source: Public Records
Mortgage History
| Date | Status | Borrower | Loan Amount |
|---|---|---|---|
| Previous Owner | Nadeau Steven L | $24,317 | |
| Previous Owner | Nadeau Steven L | $200,636 | |
| Previous Owner | Nadeau Steven L | $197,671 |
Source: Public Records
Tax History
| Year | Tax Paid | Tax Assessment Tax Assessment Total Assessment is a certain percentage of the fair market value that is determined by local assessors to be the total taxable value of land and additions on the property. | Land | Improvement |
|---|---|---|---|---|
| 2025 | $3,635 | $286,200 | $107,900 | $178,300 |
| 2024 | $3,149 | $217,600 | $90,200 | $127,400 |
| 2023 | $3,088 | $217,600 | $90,200 | $127,400 |
| 2022 | $2,896 | $154,600 | $56,800 | $97,800 |
| 2021 | $2,896 | $154,600 | $56,800 | $97,800 |
| 2020 | $2,896 | $154,600 | $56,800 | $97,800 |
| 2019 | $2,896 | $154,600 | $56,800 | $97,800 |
| 2018 | $2,396 | $115,200 | $54,600 | $60,600 |
| 2017 | $2,332 | $115,200 | $54,600 | $60,600 |
| 2016 | $2,332 | $115,200 | $54,600 | $60,600 |
| 2015 | $2,289 | $110,300 | $49,400 | $60,900 |
| 2014 | $2,213 | $110,300 | $49,400 | $60,900 |
| 2013 | $2,183 | $110,300 | $49,400 | $60,900 |
Source: Public Records
Map
Nearby Homes
Your Personal Tour Guide
Ask me questions while you tour the home.