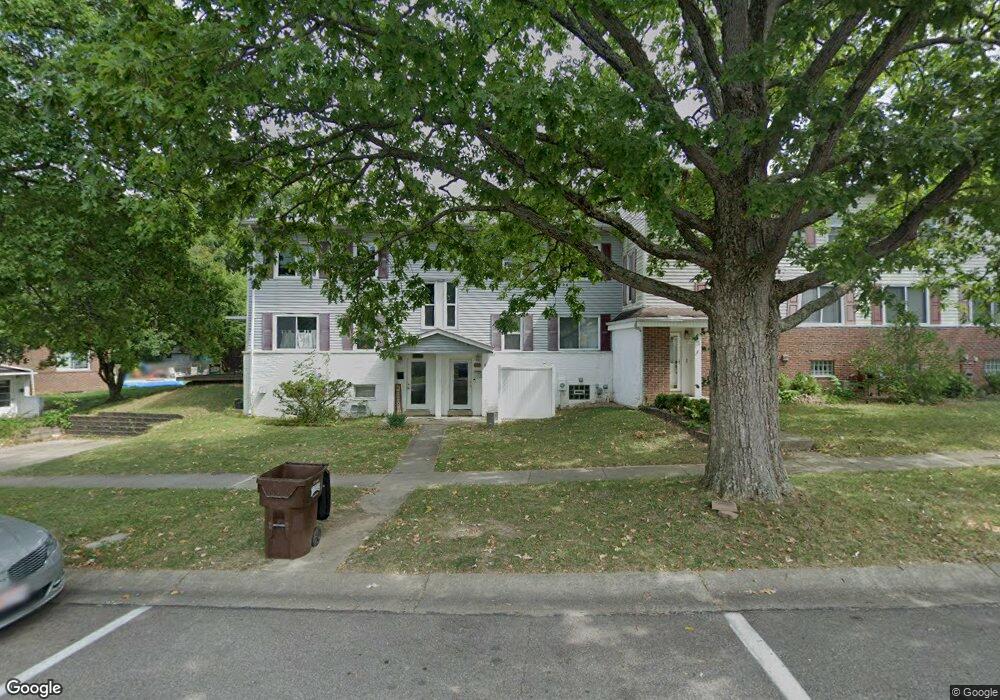
61 Burley Cir Cincinnati, OH 45218
Estimated Value: $148,000 - $161,000
3
Beds
1
Bath
1,248
Sq Ft
$124/Sq Ft
Est. Value
About This Home
This home is located at 61 Burley Cir, Cincinnati, OH 45218 and is currently estimated at $154,668, approximately $123 per square foot. 61 Burley Cir is a home located in Hamilton County with nearby schools including Central Montessori Academy and John Paul II Catholic School.
Ownership History
Date
Name
Owned For
Owner Type
Purchase Details
Closed on
Jul 1, 2021
Sold by
Fink Zachary W and Fink Angela S
Bought by
Walker Keyairria Angel
Current Estimated Value
Home Financials for this Owner
Home Financials are based on the most recent Mortgage that was taken out on this home.
Original Mortgage
$101,624
Outstanding Balance
$92,208
Interest Rate
2.9%
Mortgage Type
FHA
Estimated Equity
$62,460
Purchase Details
Closed on
Jan 12, 2009
Sold by
The Sercretary Of Housing & Urban Develo
Bought by
Fink Zachary W
Purchase Details
Closed on
May 16, 2008
Sold by
Johnson Jennifer and Johnson Mark
Bought by
Secretary Of Housing & Urban Development
Purchase Details
Closed on
Mar 12, 2003
Sold by
Jennifer Pez and Jennifer J
Bought by
Johnson Mark and Johnson Jennifer
Home Financials for this Owner
Home Financials are based on the most recent Mortgage that was taken out on this home.
Original Mortgage
$86,700
Interest Rate
5.96%
Purchase Details
Closed on
Jun 25, 1999
Sold by
Collins Joyce A
Bought by
Pez Jennifer
Home Financials for this Owner
Home Financials are based on the most recent Mortgage that was taken out on this home.
Original Mortgage
$52,500
Interest Rate
8.37%
Create a Home Valuation Report for This Property
The Home Valuation Report is an in-depth analysis detailing your home's value as well as a comparison with similar homes in the area
Home Values in the Area
Average Home Value in this Area
Purchase History
| Date | Buyer | Sale Price | Title Company |
|---|---|---|---|
| Walker Keyairria Angel | $103,500 | Tandem Title Agency Llc | |
| Fink Zachary W | $30,400 | None Available | |
| Secretary Of Housing & Urban Development | $50,000 | None Available | |
| Johnson Mark | -- | -- | |
| Pez Jennifer | $75,000 | -- |
Source: Public Records
Mortgage History
| Date | Status | Borrower | Loan Amount |
|---|---|---|---|
| Open | Walker Keyairria Angel | $101,624 | |
| Previous Owner | Johnson Mark | $86,700 | |
| Previous Owner | Pez Jennifer | $52,500 |
Source: Public Records
Tax History Compared to Growth
Tax History
| Year | Tax Paid | Tax Assessment Tax Assessment Total Assessment is a certain percentage of the fair market value that is determined by local assessors to be the total taxable value of land and additions on the property. | Land | Improvement |
|---|---|---|---|---|
| 2024 | $2,406 | $36,226 | $3,854 | $32,372 |
| 2023 | $2,247 | $36,226 | $3,854 | $32,372 |
| 2022 | $1,706 | $20,496 | $3,220 | $17,276 |
| 2021 | $1,767 | $20,496 | $3,220 | $17,276 |
| 2020 | $1,747 | $20,496 | $3,220 | $17,276 |
| 2019 | $1,707 | $17,518 | $2,751 | $14,767 |
| 2018 | $1,986 | $17,518 | $2,751 | $14,767 |
| 2017 | $1,608 | $17,518 | $2,751 | $14,767 |
| 2016 | $986 | $10,322 | $3,052 | $7,270 |
| 2015 | $917 | $10,322 | $3,052 | $7,270 |
| 2014 | $936 | $10,322 | $3,052 | $7,270 |
| 2013 | $938 | $10,641 | $3,147 | $7,494 |
Source: Public Records
Map
Nearby Homes