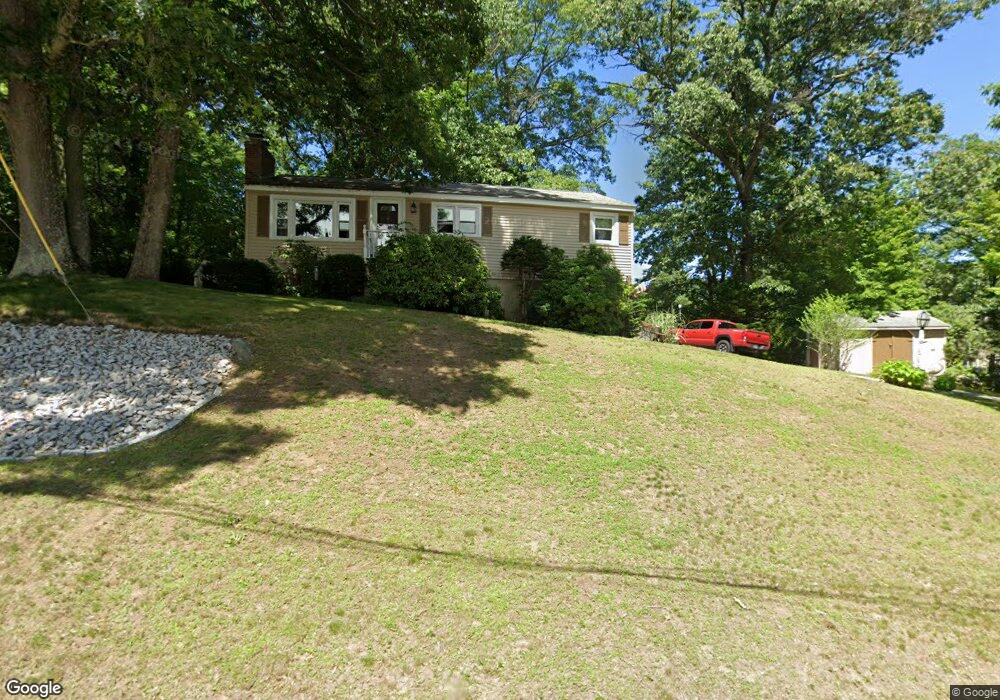
61 Carousel Dr Millbury, MA 01527
Estimated Value: $421,461 - $483,000
3
Beds
2
Baths
1,134
Sq Ft
$396/Sq Ft
Est. Value
About This Home
This home is located at 61 Carousel Dr, Millbury, MA 01527 and is currently estimated at $448,865, approximately $395 per square foot. 61 Carousel Dr is a home located in Worcester County with nearby schools including Elmwood Street Elementary School, Raymond E. Shaw Elementary School, and Millbury Junior/Senior High School.
Ownership History
Date
Name
Owned For
Owner Type
Purchase Details
Closed on
Jul 31, 2017
Sold by
Pierce Ethel M Est and Pierce
Bought by
Pierce Andrea
Current Estimated Value
Home Financials for this Owner
Home Financials are based on the most recent Mortgage that was taken out on this home.
Original Mortgage
$125,500
Outstanding Balance
$104,527
Interest Rate
4.5%
Mortgage Type
New Conventional
Estimated Equity
$344,338
Purchase Details
Closed on
Apr 24, 1984
Bought by
Pierce Ethel M
Create a Home Valuation Report for This Property
The Home Valuation Report is an in-depth analysis detailing your home's value as well as a comparison with similar homes in the area
Home Values in the Area
Average Home Value in this Area
Purchase History
| Date | Buyer | Sale Price | Title Company |
|---|---|---|---|
| Pierce Andrea | $150,000 | -- | |
| Pierce Andrea M | $150,000 | -- | |
| Pierce Ethel M | -- | -- |
Source: Public Records
Mortgage History
| Date | Status | Borrower | Loan Amount |
|---|---|---|---|
| Open | Pierce Andrea M | $125,500 | |
| Closed | Pierce Andrea M | $125,500 | |
| Previous Owner | Pierce Ethel M | $24,000 |
Source: Public Records
Tax History
| Year | Tax Paid | Tax Assessment Tax Assessment Total Assessment is a certain percentage of the fair market value that is determined by local assessors to be the total taxable value of land and additions on the property. | Land | Improvement |
|---|---|---|---|---|
| 2025 | $4,495 | $335,700 | $114,600 | $221,100 |
| 2024 | $4,126 | $311,900 | $106,100 | $205,800 |
| 2023 | $3,705 | $256,400 | $74,500 | $181,900 |
| 2022 | $3,555 | $237,000 | $74,500 | $162,500 |
| 2021 | $3,496 | $226,600 | $74,500 | $152,100 |
| 2020 | $3,416 | $222,800 | $74,500 | $148,300 |
| 2019 | $3,378 | $213,100 | $74,100 | $139,000 |
| 2018 | $4,750 | $196,200 | $74,100 | $122,100 |
| 2017 | $3,148 | $191,600 | $77,300 | $114,300 |
| 2016 | $3,178 | $193,100 | $77,300 | $115,800 |
| 2015 | $3,215 | $195,300 | $82,200 | $113,100 |
| 2014 | $3,076 | $179,900 | $82,200 | $97,700 |
Source: Public Records
Map
Nearby Homes
Your Personal Tour Guide
Ask me questions while you tour the home.