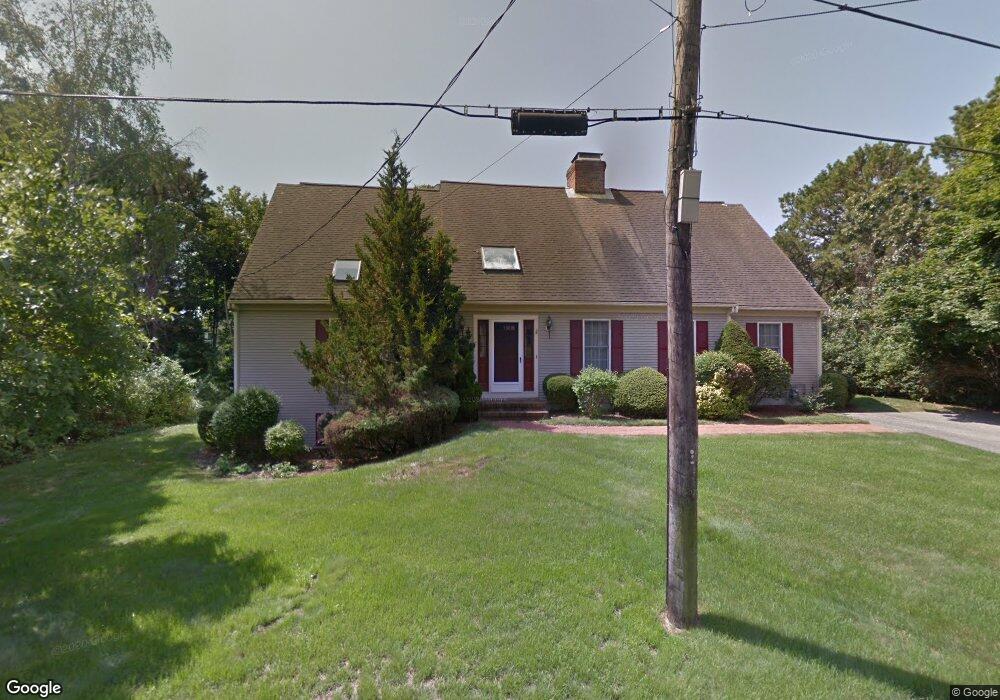
61 Chase Ave West Dennis, MA 2670
West Dennis NeighborhoodEstimated Value: $6,882,864
--
Bed
--
Bath
--
Sq Ft
0.78
Acres
About This Home
This home is located at 61 Chase Ave, West Dennis, MA 2670 and is currently priced at $6,882,864. 61 Chase Ave is a home located in Barnstable County with nearby schools including Dennis-Yarmouth Regional High School and St. Pius X. School.
Ownership History
Date
Name
Owned For
Owner Type
Purchase Details
Closed on
Nov 26, 2024
Sold by
Bluegreen Vacations Unltd
Bought by
Vacation Tinc
Current Estimated Value
Home Financials for this Owner
Home Financials are based on the most recent Mortgage that was taken out on this home.
Original Mortgage
$62,557
Outstanding Balance
$61,952
Interest Rate
6.79%
Mortgage Type
Purchase Money Mortgage
Purchase Details
Closed on
Jan 29, 2003
Sold by
Sim Properties Inc
Bought by
Breakers Resort Llc
Purchase Details
Closed on
Apr 8, 1991
Sold by
Rtc
Bought by
Sim Properties Inc
Purchase Details
Closed on
Mar 25, 1991
Sold by
Zimmerman Seymour I and Zimmerman Jeanne H
Bought by
Rtc
Create a Home Valuation Report for This Property
The Home Valuation Report is an in-depth analysis detailing your home's value as well as a comparison with similar homes in the area
Home Values in the Area
Average Home Value in this Area
Purchase History
| Date | Buyer | Sale Price | Title Company |
|---|---|---|---|
| Vacation Tinc | $49,803 | None Available | |
| Vacation Tinc | $49,803 | None Available | |
| Vacation Tinc | $49,803 | None Available | |
| Breakers Resort Llc | $2,800,000 | -- | |
| Breakers Resort Llc | $2,800,000 | -- | |
| Sim Properties Inc | $1,045,000 | -- | |
| Sim Properties Inc | $1,045,000 | -- | |
| Rtc | $1,600,000 | -- |
Source: Public Records
Mortgage History
| Date | Status | Borrower | Loan Amount |
|---|---|---|---|
| Open | Vacation Tinc | $62,557 | |
| Closed | Vacation Tinc | $62,557 |
Source: Public Records
Tax History Compared to Growth
Tax History
| Year | Tax Paid | Tax Assessment Tax Assessment Total Assessment is a certain percentage of the fair market value that is determined by local assessors to be the total taxable value of land and additions on the property. | Land | Improvement |
|---|---|---|---|---|
| 2025 | $19,299 | $4,457,000 | $1,743,500 | $2,713,500 |
| 2024 | $19,352 | $4,408,100 | $1,680,000 | $2,728,100 |
| 2023 | $19,599 | $4,196,800 | $1,600,200 | $2,596,600 |
| 2022 | $22,164 | $3,957,900 | $1,509,500 | $2,448,400 |
| 2021 | $23,058 | $3,823,800 | $1,479,900 | $2,343,900 |
| 2020 | $22,909 | $3,755,600 | $1,468,800 | $2,286,800 |
| 2019 | $24,942 | $4,042,400 | $1,468,800 | $2,573,600 |
| 2018 | $25,643 | $4,044,700 | $1,468,800 | $2,575,900 |
| 2017 | $24,876 | $4,044,800 | $1,468,900 | $2,575,900 |
| 2016 | $26,074 | $3,992,900 | $1,468,900 | $2,524,000 |
| 2015 | $25,555 | $3,992,900 | $1,468,900 | $2,524,000 |
| 2014 | $25,166 | $3,963,100 | $1,468,900 | $2,494,200 |
Source: Public Records
Map
Nearby Homes
- 2 Rita Mary Way
- 308 Old Main St
- 181 Pleasant St
- 14 Schoolhouse Ln
- 45 Seth Ln
- 40 Kelley Rd
- 209 Main St Unit 3
- 209 Main St Unit 6
- 209 Main St Unit 1
- 209 Main St Unit 2
- 209 Main St Unit 4
- 209 Main St Unit 5
- 22 Powhatan Rd
- 23 Doric Ave
- 29 Bass River Rd
- 15 Sharon Rd
- 18 Turner Ln
- 178 School St
- 116 N Main St
- 7 Sunset Pines Rd
- 79 Chase Ave
- 67 Chase Ave
- 57 Chase Ave
- 112 Uncle Barneys Rd
- 60 Chase Ave
- 76 Chase Ave
- 82 Chase Ave
- 56 Chase Ave
- 0 Uncle Barneys Rd
- 88 Chase Ave
- 118 Uncle Barneys Rd
- 36 Chase Ave
- 36 Chase Ave
- 100 Uncle Barneys Rd
- 21 Chase Ave
- 115 Uncle Barneys Rd
- 2 Uncle Freemans Rd
- 33 Chase Ave
- 105 Uncle Barneys Rd
- 21 Chase Ave