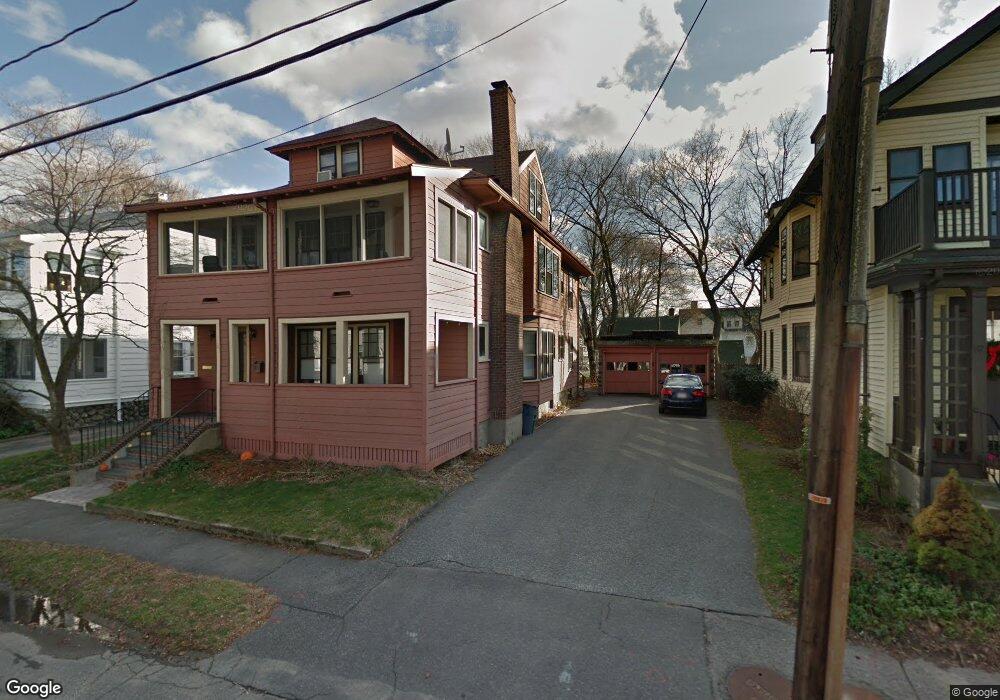
61 Chester Rd Unit 63 Belmont, MA 02478
Cushing Square NeighborhoodEstimated Value: $701,000 - $893,000
2
Beds
1
Bath
1,210
Sq Ft
$646/Sq Ft
Est. Value
About This Home
This home is located at 61 Chester Rd Unit 63, Belmont, MA 02478 and is currently estimated at $781,159, approximately $645 per square foot. 61 Chester Rd Unit 63 is a home located in Middlesex County with nearby schools including Roger Wellington Elementary School, Winthrop L Chenery Middle School, and Belmont High School.
Ownership History
Date
Name
Owned For
Owner Type
Purchase Details
Closed on
Feb 10, 2020
Sold by
Brown David and Brown Deborah
Bought by
Lou Xiabing and Qian Yue
Current Estimated Value
Home Financials for this Owner
Home Financials are based on the most recent Mortgage that was taken out on this home.
Original Mortgage
$496,000
Outstanding Balance
$440,171
Interest Rate
3.72%
Mortgage Type
New Conventional
Estimated Equity
$340,988
Purchase Details
Closed on
Dec 12, 2018
Sold by
Boyd Robert C and Rumbley Laura E
Bought by
Brown David and Brown Deborah
Purchase Details
Closed on
May 18, 2009
Sold by
Caulfield Margaret A
Bought by
Boyd Robert Clark and Rumbley Laura E
Home Financials for this Owner
Home Financials are based on the most recent Mortgage that was taken out on this home.
Original Mortgage
$324,000
Interest Rate
4.85%
Mortgage Type
Purchase Money Mortgage
Purchase Details
Closed on
Jun 23, 2000
Sold by
Tierney Patrick J and Tierney Cheryl D
Bought by
Caulfield Margaret A
Home Financials for this Owner
Home Financials are based on the most recent Mortgage that was taken out on this home.
Original Mortgage
$150,000
Interest Rate
8.48%
Mortgage Type
Purchase Money Mortgage
Create a Home Valuation Report for This Property
The Home Valuation Report is an in-depth analysis detailing your home's value as well as a comparison with similar homes in the area
Home Values in the Area
Average Home Value in this Area
Purchase History
| Date | Buyer | Sale Price | Title Company |
|---|---|---|---|
| Lou Xiabing | $620,000 | None Available | |
| Brown David | $565,000 | -- | |
| Boyd Robert Clark | $360,000 | -- | |
| Caulfield Margaret A | $282,000 | -- |
Source: Public Records
Mortgage History
| Date | Status | Borrower | Loan Amount |
|---|---|---|---|
| Open | Lou Xiabing | $496,000 | |
| Previous Owner | Boyd Robert Clark | $324,000 | |
| Previous Owner | Caulfield Margaret A | $150,000 | |
| Previous Owner | Caulfield Margaret A | $150,000 |
Source: Public Records
Tax History Compared to Growth
Tax History
| Year | Tax Paid | Tax Assessment Tax Assessment Total Assessment is a certain percentage of the fair market value that is determined by local assessors to be the total taxable value of land and additions on the property. | Land | Improvement |
|---|---|---|---|---|
| 2025 | $8,702 | $764,000 | $0 | $764,000 |
| 2024 | $7,867 | $745,000 | $0 | $745,000 |
| 2023 | $7,890 | $702,000 | $0 | $702,000 |
| 2022 | $6,624 | $573,000 | $0 | $573,000 |
| 2021 | $6,232 | $540,000 | $0 | $540,000 |
| 2020 | $5,841 | $531,000 | $0 | $531,000 |
| 2019 | $5,076 | $435,000 | $0 | $435,000 |
| 2018 | $5,431 | $447,000 | $0 | $447,000 |
| 2017 | $5,355 | $422,000 | $0 | $422,000 |
| 2016 | $5,250 | $418,000 | $0 | $418,000 |
| 2015 | $4,941 | $383,000 | $0 | $383,000 |
Source: Public Records
Map
Nearby Homes
- 68 Payson Rd
- 333 Common St
- 11 Payson Rd Unit 11
- 50 Hammond Rd
- 125 Trapelo Rd Unit 23
- 125 Trapelo Rd Unit 21
- 263 Common St
- 190 Goden St
- 59-61 Gilbert Rd
- 88 Palfrey Rd Unit 88
- 532 Belmont St
- 7 Pine St
- 79 Livermore Rd
- 2 Bartlett Ave Unit 1
- 30 Merrill Rd
- 16 Fairmont St
- 38-40 Wiley Rd
- 456 Belmont St Unit 10
- 315 Waverley St
- 239 Beech St
- 61 Chester Rd Unit 63
- 61 Chester Rd Unit 61,61-63
- 63 Chester Rd Unit 63
- 61-63 Chester Rd Unit 1
- 65 Chester Rd
- 65 Chester Rd Unit 1
- 57 Chester Rd
- 69 Chester Rd
- 69 Chester Rd Unit 1
- 3 Carleton Rd
- 3 Carleton Rd Unit 2
- 53 Chester Rd
- 66 Chester Rd Unit 1
- 66 Chester Rd Unit 68
- 68 Chester Rd Unit 2
- 9 Carleton Rd
- 72 Payson Rd
- 7 Carleton Rd
- 7 - 9 Carleton
- 73 Chester Rd