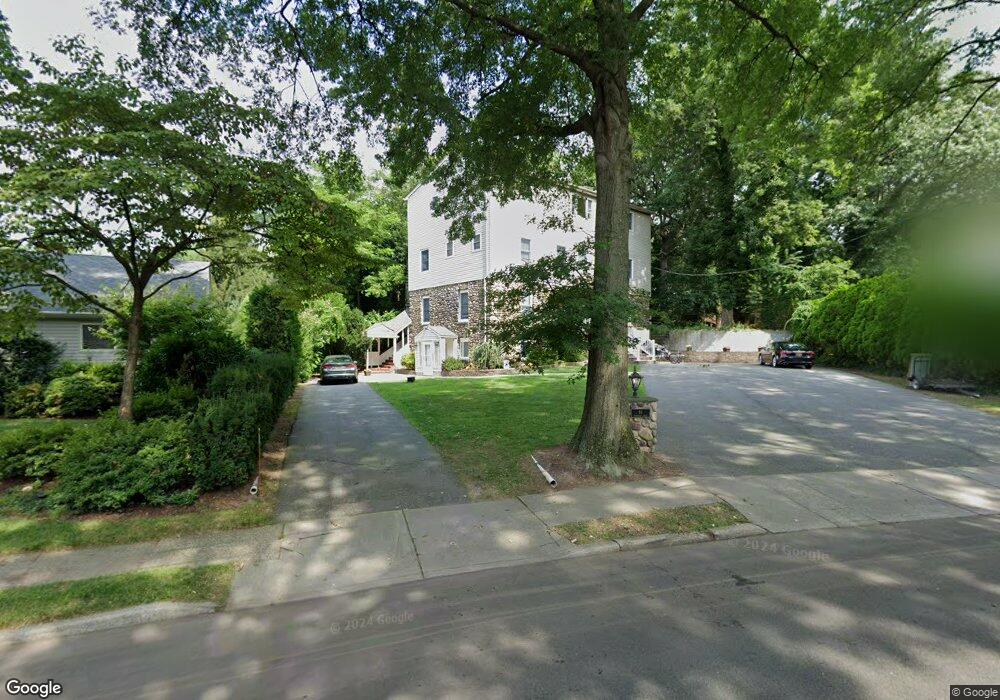
61 Demarest Rd Unit 2 Paramus, NJ 07652
Estimated Value: $1,930,000 - $2,333,000
3
Beds
2
Baths
5,304
Sq Ft
$384/Sq Ft
Est. Value
About This Home
This home is located at 61 Demarest Rd Unit 2, Paramus, NJ 07652 and is currently estimated at $2,038,646, approximately $384 per square foot. 61 Demarest Rd Unit 2 is a home located in Bergen County with nearby schools including Paramus High School, David Gregory School, and Paramus Catholic High School.
Ownership History
Date
Name
Owned For
Owner Type
Purchase Details
Closed on
Apr 10, 2018
Sold by
Daley Kerry
Bought by
Forsdahl Charles E
Current Estimated Value
Purchase Details
Closed on
Oct 4, 2013
Sold by
Mcphee Sid P
Bought by
Forsdahl Charles E and Forsdahl Kerry
Home Financials for this Owner
Home Financials are based on the most recent Mortgage that was taken out on this home.
Original Mortgage
$777,000
Interest Rate
4.56%
Mortgage Type
Stand Alone Refi Refinance Of Original Loan
Purchase Details
Closed on
Nov 12, 1996
Sold by
Postolowski Walter
Bought by
Mcphee Sid P
Home Financials for this Owner
Home Financials are based on the most recent Mortgage that was taken out on this home.
Original Mortgage
$250,000
Interest Rate
7.81%
Create a Home Valuation Report for This Property
The Home Valuation Report is an in-depth analysis detailing your home's value as well as a comparison with similar homes in the area
Home Values in the Area
Average Home Value in this Area
Purchase History
| Date | Buyer | Sale Price | Title Company |
|---|---|---|---|
| Forsdahl Charles E | -- | -- | |
| Forsdahl Charles E | $1,150,000 | -- | |
| Mcphee Sid P | $392,500 | -- |
Source: Public Records
Mortgage History
| Date | Status | Borrower | Loan Amount |
|---|---|---|---|
| Previous Owner | Forsdahl Charles E | $777,000 | |
| Previous Owner | Mcphee Sid P | $250,000 |
Source: Public Records
Tax History
| Year | Tax Paid | Tax Assessment Tax Assessment Total Assessment is a certain percentage of the fair market value that is determined by local assessors to be the total taxable value of land and additions on the property. | Land | Improvement |
|---|---|---|---|---|
| 2025 | $18,766 | $1,348,500 | $502,800 | $845,700 |
| 2024 | $18,060 | $1,239,500 | $438,300 | $801,200 |
| 2023 | $17,106 | $1,177,300 | $417,300 | $760,000 |
| 2022 | $17,106 | $1,102,200 | $390,200 | $712,000 |
| 2021 | $16,666 | $1,007,600 | $355,600 | $652,000 |
| 2020 | $15,720 | $985,600 | $345,600 | $640,000 |
| 2019 | $14,956 | $805,800 | $350,900 | $454,900 |
| 2018 | $14,770 | $805,800 | $350,900 | $454,900 |
| 2017 | $14,512 | $805,800 | $350,900 | $454,900 |
| 2016 | $14,118 | $805,800 | $350,900 | $454,900 |
| 2015 | $13,973 | $805,800 | $350,900 | $454,900 |
| 2014 | $13,852 | $805,800 | $350,900 | $454,900 |
Source: Public Records
Map
Nearby Homes
- 84 W Midland Ave
- 11 Gabriel Ct
- 14 Gabriel Ct
- 19 Gabriel Ct
- 24 Gabriel Ct
- 16 Gabriel Ct
- 496 Cedar Ln
- 218 Mayfair Rd
- 232 W Midland Ave
- 461 Arthur Terrace
- 375 Burnet Place
- 495 Paramus Rd
- 360 Valley View Ave
- 298 Buttonwood Dr
- 304 Blauvelt Ct
- 105 Circle Dr
- 82 Azalea St
- 86 Azalea St
- 645 Cambridge Rd
- 648 Falmouth Ave
Your Personal Tour Guide
Ask me questions while you tour the home.