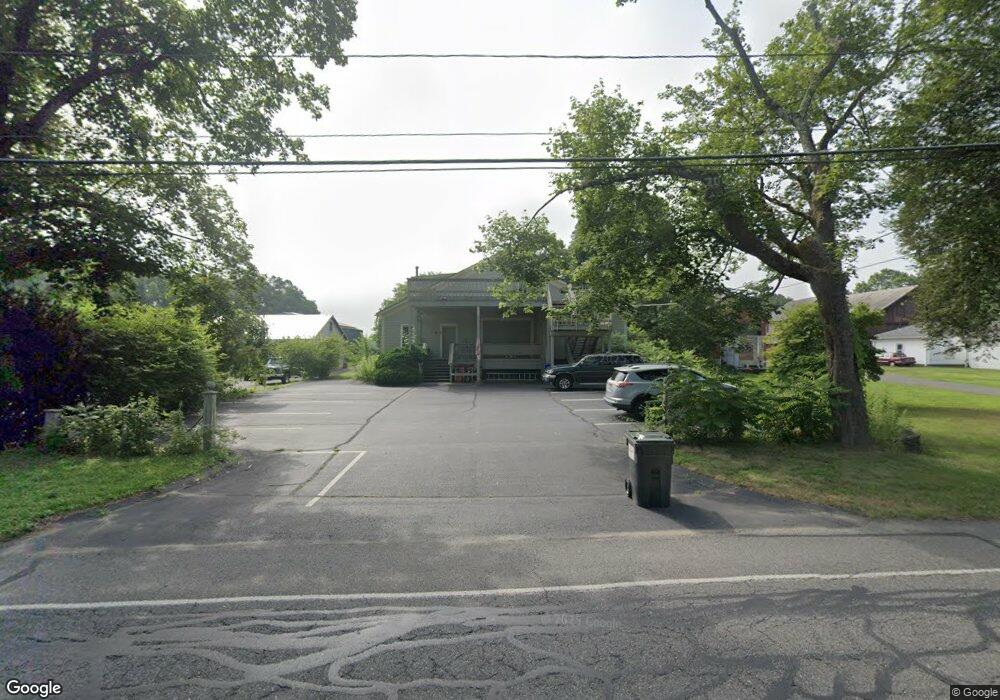
61 Elm St Hatfield, MA 01038
Estimated Value: $418,866
1
Bed
6
Baths
9,006
Sq Ft
$47/Sq Ft
Est. Value
About This Home
This home is located at 61 Elm St, Hatfield, MA 01038 and is currently estimated at $418,866, approximately $46 per square foot. 61 Elm St is a home located in Hampshire County with nearby schools including Hatfield Elementary School, Smith Academy, and The Montessori School of Northampton.
Ownership History
Date
Name
Owned For
Owner Type
Purchase Details
Closed on
Nov 19, 2003
Sold by
16 Arnold Place Nt and Lanning Nancy B
Bought by
Lanning Anne Digan and Lanning Stephen B
Current Estimated Value
Home Financials for this Owner
Home Financials are based on the most recent Mortgage that was taken out on this home.
Original Mortgage
$140,000
Outstanding Balance
$64,814
Interest Rate
5.98%
Mortgage Type
Commercial
Estimated Equity
$355,792
Create a Home Valuation Report for This Property
The Home Valuation Report is an in-depth analysis detailing your home's value as well as a comparison with similar homes in the area
Home Values in the Area
Average Home Value in this Area
Purchase History
We collect this data history from publicly available records. To have your information removed, we recommend requesting removal directly through your county’s website.
| Date | Buyer | Sale Price | Title Company |
|---|---|---|---|
| Lanning Anne Digan | $200,000 | -- |
Source: Public Records
Mortgage History
We collect this data history from publicly available records. To have your information removed, we recommend requesting removal directly through your county’s website.
| Date | Status | Borrower | Loan Amount |
|---|---|---|---|
| Open | Lanning Anne Digan | $140,000 | |
| Closed | Lanning Anne Digan | $85,000 |
Source: Public Records
Tax History
| Year | Tax Paid | Tax Assessment Tax Assessment Total Assessment is a certain percentage of the fair market value that is determined by local assessors to be the total taxable value of land and additions on the property. | Land | Improvement |
|---|---|---|---|---|
| 2025 | $7,745 | $559,600 | $136,300 | $423,300 |
| 2024 | $8,105 | $529,400 | $125,800 | $403,600 |
| 2023 | $6,611 | $490,400 | $115,300 | $375,100 |
| 2022 | $6,704 | $490,400 | $115,300 | $375,100 |
| 2021 | $6,759 | $476,300 | $111,100 | $365,200 |
| 2020 | $6,444 | $476,300 | $111,100 | $365,200 |
| 2019 | $6,324 | $455,300 | $104,900 | $350,400 |
| 2018 | $6,186 | $455,500 | $104,900 | $350,600 |
| 2017 | $6,022 | $455,500 | $104,900 | $350,600 |
| 2016 | $6,003 | $455,500 | $104,900 | $350,600 |
| 2015 | $5,804 | $440,700 | $104,900 | $335,800 |
| 2014 | $5,584 | $440,700 | $104,900 | $335,800 |
Source: Public Records
Map
Nearby Homes
- 15 Main St
- 26 Gore Ave
- 58 Main St Unit 3
- 0 N Branch Rd
- 55 Laurel Park Unit 55
- 26 Russell St Unit A-B
- 555 Coles Meadow Rd
- 136 Main St
- 115 West St
- 80 Damon Rd Unit 2303
- 0 Straits Rd
- 128 West St
- 1 Kozera Ave
- 351 Bridge St
- 277 River Dr
- 74 N Hatfield Rd
- 20 View Ave
- Lot 1 N Hatfield Rd
- Lot 2 N Hatfield Rd
- 0 N King St
Your Personal Tour Guide
Ask me questions while you tour the home.