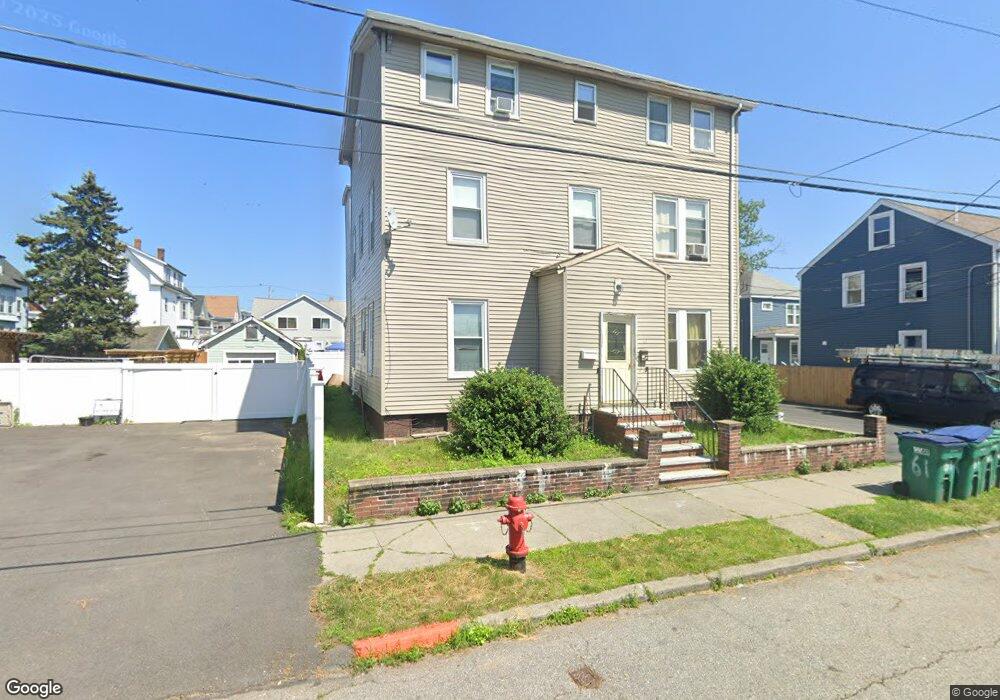
61 Grove St Lynn, MA 01905
Pine Hill NeighborhoodEstimated Value: $675,000 - $968,000
8
Beds
3
Baths
3,564
Sq Ft
$238/Sq Ft
Est. Value
About This Home
This home is located at 61 Grove St, Lynn, MA 01905 and is currently estimated at $848,196, approximately $237 per square foot. 61 Grove St is a home located in Essex County with nearby schools including North Park Elementary School, William R. Fallon School, and Tracy Elementary School.
Ownership History
Date
Name
Owned For
Owner Type
Purchase Details
Closed on
Mar 20, 2025
Sold by
Amaefuna Patricia
Bought by
Pamaefuna Ft and Amaefuna
Current Estimated Value
Purchase Details
Closed on
May 19, 2003
Sold by
Potter David J
Bought by
Amaefuna Patricia U
Purchase Details
Closed on
Jul 16, 2001
Sold by
Allen Albert Archibal and Allen Mary
Bought by
Potter David J
Purchase Details
Closed on
Jan 13, 1994
Sold by
Usa
Bought by
Allen Albert and Allen Mary
Purchase Details
Closed on
Oct 16, 1992
Sold by
Fleet Mtg Corp
Bought by
United State Of Amer
Purchase Details
Closed on
Sep 17, 1992
Sold by
Elmstrom Richard and Elmstrom Ricahrd
Bought by
Fleet Mtg Corp
Create a Home Valuation Report for This Property
The Home Valuation Report is an in-depth analysis detailing your home's value as well as a comparison with similar homes in the area
Home Values in the Area
Average Home Value in this Area
Purchase History
| Date | Buyer | Sale Price | Title Company |
|---|---|---|---|
| Pamaefuna Ft | -- | None Available | |
| Pamaefuna Ft | -- | None Available | |
| Pamaefuna Ft | -- | None Available | |
| Amaefuna Patricia U | $349,900 | -- | |
| Amaefuna Patricia U | $349,900 | -- | |
| Potter David J | $130,000 | -- | |
| Potter David J | $130,000 | -- | |
| Allen Albert | $31,200 | -- | |
| Allen Albert | $31,200 | -- | |
| United State Of Amer | $33,843 | -- | |
| United State Of Amer | $33,843 | -- | |
| Fleet Mtg Corp | $33,843 | -- | |
| Fleet Mtg Corp | $33,843 | -- |
Source: Public Records
Mortgage History
| Date | Status | Borrower | Loan Amount |
|---|---|---|---|
| Previous Owner | Fleet Mtg Corp | $15,000 | |
| Previous Owner | Fleet Mtg Corp | $40,000 |
Source: Public Records
Tax History Compared to Growth
Tax History
| Year | Tax Paid | Tax Assessment Tax Assessment Total Assessment is a certain percentage of the fair market value that is determined by local assessors to be the total taxable value of land and additions on the property. | Land | Improvement |
|---|---|---|---|---|
| 2025 | $9,293 | $896,981 | $186,800 | $710,181 |
| 2024 | $8,762 | $832,100 | $175,500 | $656,600 |
| 2023 | $8,703 | $780,500 | $170,000 | $610,500 |
| 2022 | $8,991 | $723,300 | $157,500 | $565,800 |
| 2021 | $8,535 | $655,000 | $151,200 | $503,800 |
| 2020 | $7,789 | $581,300 | $133,300 | $448,000 |
| 2019 | $7,304 | $510,800 | $109,000 | $401,800 |
| 2018 | $6,502 | $429,200 | $90,700 | $338,500 |
| 2017 | $6,125 | $392,600 | $76,900 | $315,700 |
| 2016 | $5,613 | $346,900 | $68,500 | $278,400 |
| 2015 | $5,201 | $310,500 | $63,900 | $246,600 |
Source: Public Records
Map
Nearby Homes
- 75 Grove St
- 75 Moulton St
- 40 Grove St
- 25 Bulfinch St
- 11 Linwood Rd
- 274 Boston St
- 10 Carnes St
- 66 Harwood St
- 447 Boston St
- 93 Robinson St
- 662-664 Western Ave
- 39 Centre St
- 108 Franklin St
- 693 Western Ave Unit 101
- 14 Atkinson St
- 99 Franklin St
- 43 Baker St
- 93 Franklin St
- 121 N Common St
- 121 Johnson St Unit 3L