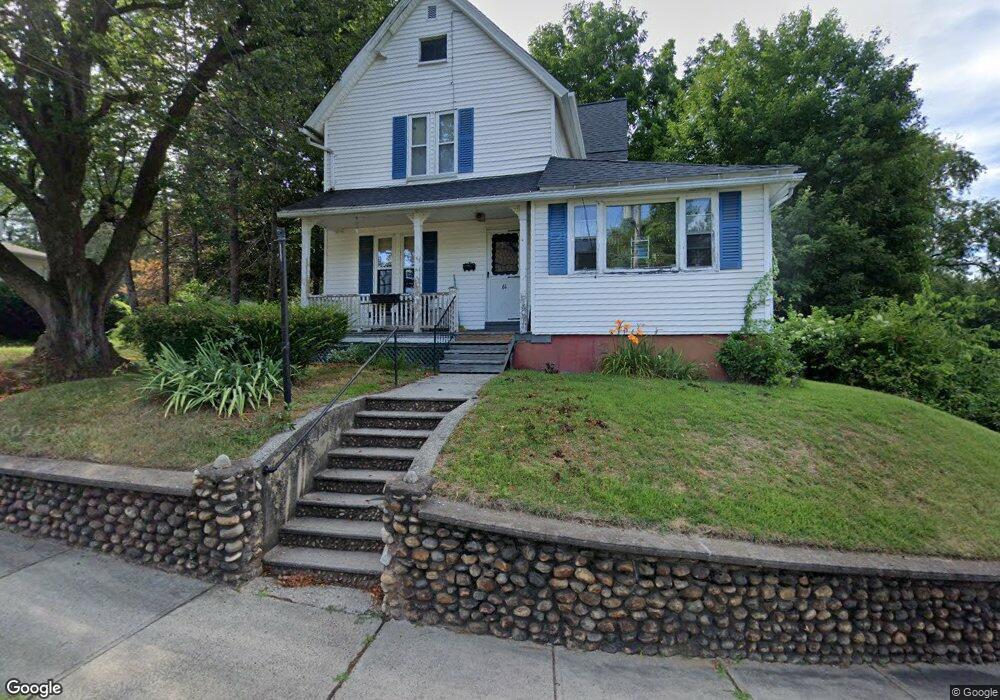
61 Hilton St Chicopee, MA 01020
Chicopee Falls NeighborhoodEstimated Value: $291,000 - $323,000
3
Beds
2
Baths
1,600
Sq Ft
$195/Sq Ft
Est. Value
About This Home
This home is located at 61 Hilton St, Chicopee, MA 01020 and is currently estimated at $312,563, approximately $195 per square foot. 61 Hilton St is a home located in Hampden County with nearby schools including Belcher Elementary School, Bellamy Middle School, and Chicopee High School.
Ownership History
Date
Name
Owned For
Owner Type
Purchase Details
Closed on
Apr 21, 2004
Sold by
Winsky Rachel I and Miles Scott A
Bought by
Daly John V
Current Estimated Value
Home Financials for this Owner
Home Financials are based on the most recent Mortgage that was taken out on this home.
Original Mortgage
$137,970
Outstanding Balance
$63,747
Interest Rate
5.4%
Mortgage Type
VA
Estimated Equity
$248,816
Purchase Details
Closed on
Jul 31, 2003
Sold by
Moran George F
Bought by
Miles Scott A and Winsky Rachel I
Home Financials for this Owner
Home Financials are based on the most recent Mortgage that was taken out on this home.
Original Mortgage
$118,146
Interest Rate
5.28%
Mortgage Type
Purchase Money Mortgage
Create a Home Valuation Report for This Property
The Home Valuation Report is an in-depth analysis detailing your home's value as well as a comparison with similar homes in the area
Home Values in the Area
Average Home Value in this Area
Purchase History
We collect this data history from publicly available records. To have your information removed, we recommend requesting removal directly through your county’s website.
| Date | Buyer | Sale Price | Title Company |
|---|---|---|---|
| Daly John V | $135,000 | -- | |
| Miles Scott A | $120,000 | -- |
Source: Public Records
Mortgage History
We collect this data history from publicly available records. To have your information removed, we recommend requesting removal directly through your county’s website.
| Date | Status | Borrower | Loan Amount |
|---|---|---|---|
| Open | Daly John V | $137,970 | |
| Previous Owner | Miles Scott A | $118,146 |
Source: Public Records
Tax History
| Year | Tax Paid | Tax Assessment Tax Assessment Total Assessment is a certain percentage of the fair market value that is determined by local assessors to be the total taxable value of land and additions on the property. | Land | Improvement |
|---|---|---|---|---|
| 2025 | $4,067 | $268,300 | $93,100 | $175,200 |
| 2024 | $3,857 | $261,300 | $91,200 | $170,100 |
| 2023 | $3,622 | $239,100 | $83,000 | $156,100 |
| 2022 | $3,469 | $204,200 | $72,200 | $132,000 |
| 2021 | $3,214 | $182,500 | $61,900 | $120,600 |
| 2020 | $3,052 | $174,800 | $61,900 | $112,900 |
| 2019 | $3,003 | $167,200 | $61,900 | $105,300 |
| 2018 | $2,915 | $159,200 | $59,000 | $100,200 |
| 2017 | $2,787 | $161,000 | $51,800 | $109,200 |
| 2016 | $2,780 | $164,400 | $51,800 | $112,600 |
| 2015 | $2,863 | $163,200 | $51,800 | $111,400 |
| 2014 | $1,772 | $163,200 | $51,800 | $111,400 |
Source: Public Records
Map
Nearby Homes
- 221 East St
- 132 Ondrick Dr
- 23 Wildermere St
- 78 Glendale St
- 101 Frontenac St
- 283 Fuller Rd Unit T
- 239 Fuller Rd
- Lot (0) Royalton St
- 75 Wheatland Ave
- 51 E Canton Cir
- 582 Broadway St
- 151 Edgewood Ave
- 22 Felicia St
- 91 Ardmore St
- 1451-1453 Carew St
- 23-25 Prentice St
- 49 Fitzgerald Rd
- 44 White St
- 3 Fordham St
- 130 Celebration Cir
Your Personal Tour Guide
Ask me questions while you tour the home.