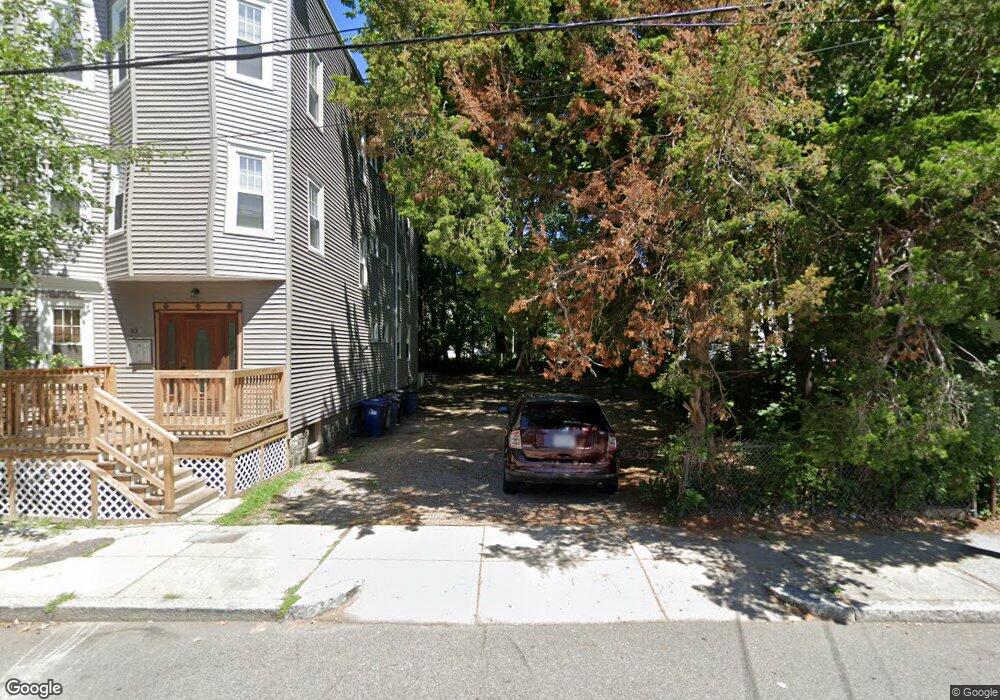
61 Hollander St Boston, MA 02121
Washington Park Neighborhood
--
Bed
--
Bath
--
Sq Ft
3,049
Sq Ft Lot
About This Home
This home is located at 61 Hollander St, Boston, MA 02121. 61 Hollander St is a home located in Suffolk County with nearby schools including Bridge Boston Charter School.
Ownership History
Date
Name
Owned For
Owner Type
Purchase Details
Closed on
Jan 8, 2025
Sold by
267 Normandy St Llc
Bought by
Home Reconstruction Llc
Home Financials for this Owner
Home Financials are based on the most recent Mortgage that was taken out on this home.
Original Mortgage
$850,000
Outstanding Balance
$842,407
Interest Rate
6.69%
Mortgage Type
Purchase Money Mortgage
Purchase Details
Closed on
Jan 5, 2012
Sold by
Virtual Re Inc
Bought by
Ts Land T Llc
Home Financials for this Owner
Home Financials are based on the most recent Mortgage that was taken out on this home.
Original Mortgage
$84,400
Interest Rate
3.98%
Mortgage Type
New Conventional
Purchase Details
Closed on
Apr 10, 2006
Sold by
Gonsalves Donna M and Gonsalves Steven E
Bought by
Virtual Rlest Inc
Purchase Details
Closed on
Jul 27, 2005
Sold by
Brown Tashi M and Brown Theodore R
Bought by
Gonsalves Donna M and Gonsalves Steven E
Create a Home Valuation Report for This Property
The Home Valuation Report is an in-depth analysis detailing your home's value as well as a comparison with similar homes in the area
Home Values in the Area
Average Home Value in this Area
Purchase History
| Date | Buyer | Sale Price | Title Company |
|---|---|---|---|
| Home Reconstruction Llc | $200,000 | None Available | |
| Home Reconstruction Llc | $200,000 | None Available | |
| Ts Land T Llc | -- | -- | |
| Ts Land T Llc | -- | -- | |
| Ts Land T Llc | -- | -- | |
| Ts Land T Llc | -- | -- | |
| Virtual Rlest Inc | $300,000 | -- | |
| Virtual Rlest Inc | $300,000 | -- | |
| Virtual Rlest Inc | $300,000 | -- | |
| Gonsalves Donna M | $150,000 | -- | |
| Gonsalves Donna M | $150,000 | -- | |
| Gonsalves Donna M | $150,000 | -- |
Source: Public Records
Mortgage History
| Date | Status | Borrower | Loan Amount |
|---|---|---|---|
| Open | Home Reconstruction Llc | $850,000 | |
| Closed | Home Reconstruction Llc | $850,000 | |
| Previous Owner | Ts Land T Llc | $84,400 |
Source: Public Records
Tax History Compared to Growth
Tax History
| Year | Tax Paid | Tax Assessment Tax Assessment Total Assessment is a certain percentage of the fair market value that is determined by local assessors to be the total taxable value of land and additions on the property. | Land | Improvement |
|---|---|---|---|---|
| 2025 | $2,187 | $188,900 | $188,900 | $0 |
| 2024 | $298 | $27,300 | $27,300 | $0 |
| 2023 | $293 | $27,300 | $27,300 | $0 |
| 2022 | $287 | $26,400 | $26,400 | $0 |
| 2021 | $278 | $26,100 | $26,100 | $0 |
| 2020 | $223 | $21,100 | $21,100 | $0 |
| 2019 | $212 | $20,100 | $20,100 | $0 |
| 2018 | $203 | $19,400 | $19,400 | $0 |
| 2017 | $205 | $19,400 | $19,400 | $0 |
| 2016 | $197 | $17,900 | $17,900 | $0 |
| 2015 | $216 | $17,800 | $17,800 | $0 |
| 2014 | $201 | $16,000 | $16,000 | $0 |
Source: Public Records
Map
Nearby Homes
- 9 Abbotsford St Unit 1
- 4 Ruthven St
- 75 Ruthven St
- 99 Harrishof St
- 151 Townsend St
- 28 Wabon St
- 90 Munroe St
- 214 Humboldt Ave
- 41 W Walnut Park
- 164 Ruthven St Unit 1
- 16 Mayfair St
- 4 Wyoming St Unit 2
- 8 Brinton St Unit 2
- 78 Hutchings St Unit 1
- 35-37 Notre Dame St
- 26-28-30 Notre Dame St
- 495 Warren St
- 7 Waumbeck St Unit 3
- 2856 Washington St
- 27 Dixwell St Unit 11
- 55 Hollander St
- 55 Hollander St Unit 4
- 55 Hollander St
- 55 Hollander St Unit 3
- 55 Hollander St Unit 1
- 55 Hollander St Unit 2
- 55 Hollander St Unit 1,2,3
- 151 Harold St
- 54 Hollander St
- 54 Hollander St Unit 2
- 54 Hollander St Unit 3
- 63 Hollander St Unit 3
- 63 Hollander St Unit 2
- 63 Hollander St Unit 1
- 155 Harold St
- 56 Hollander St
- 42 Hollander St
- 65 Hollander St
- 65 Hollander St Unit 1
- 65 Hollander St