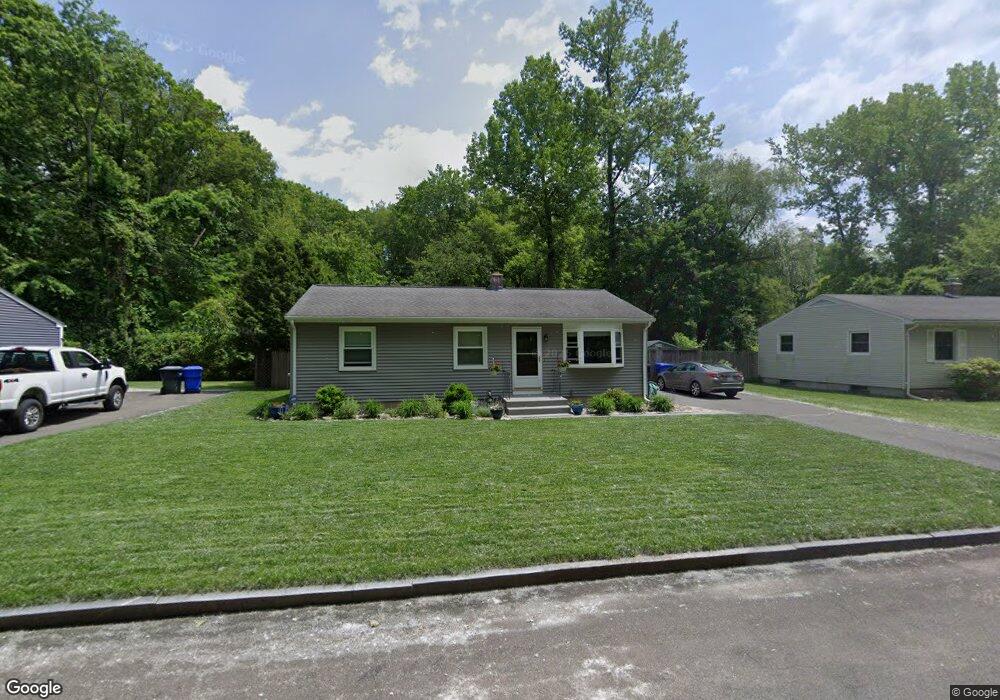
61 Hudson St Springfield, MA 01118
East Forest Park NeighborhoodEstimated Value: $300,875 - $315,000
3
Beds
1
Bath
1,053
Sq Ft
$293/Sq Ft
Est. Value
About This Home
This home is located at 61 Hudson St, Springfield, MA 01118 and is currently estimated at $308,469, approximately $292 per square foot. 61 Hudson St is a home located in Hampden County with nearby schools including Frederick Harris Elementary School, M Marcus Kiley Middle, and Springfield High School of Science and Technology.
Ownership History
Date
Name
Owned For
Owner Type
Purchase Details
Closed on
Jul 26, 1990
Sold by
Berard & Sons Inc
Bought by
Pagnoni Michael K
Current Estimated Value
Home Financials for this Owner
Home Financials are based on the most recent Mortgage that was taken out on this home.
Original Mortgage
$119,373
Interest Rate
10.01%
Mortgage Type
Purchase Money Mortgage
Create a Home Valuation Report for This Property
The Home Valuation Report is an in-depth analysis detailing your home's value as well as a comparison with similar homes in the area
Home Values in the Area
Average Home Value in this Area
Purchase History
| Date | Buyer | Sale Price | Title Company |
|---|---|---|---|
| Pagnoni Michael K | $117,900 | -- |
Source: Public Records
Mortgage History
| Date | Status | Borrower | Loan Amount |
|---|---|---|---|
| Open | Pagnoni Michael K | $40,000 | |
| Closed | Pagnoni Michael K | $121,450 | |
| Closed | Pagnoni Michael K | $119,373 |
Source: Public Records
Tax History
| Year | Tax Paid | Tax Assessment Tax Assessment Total Assessment is a certain percentage of the fair market value that is determined by local assessors to be the total taxable value of land and additions on the property. | Land | Improvement |
|---|---|---|---|---|
| 2025 | $3,950 | $251,900 | $51,400 | $200,500 |
| 2024 | $3,694 | $230,000 | $51,400 | $178,600 |
| 2023 | $3,449 | $202,300 | $49,000 | $153,300 |
| 2022 | $3,414 | $181,400 | $49,000 | $132,400 |
| 2021 | $3,428 | $181,400 | $44,500 | $136,900 |
| 2020 | $3,285 | $168,200 | $44,500 | $123,700 |
| 2019 | $3,098 | $157,400 | $44,500 | $112,900 |
| 2018 | $2,974 | $151,100 | $44,500 | $106,600 |
| 2017 | $3,006 | $152,900 | $44,500 | $108,400 |
| 2016 | $2,691 | $136,900 | $44,500 | $92,400 |
| 2015 | $2,557 | $130,000 | $44,500 | $85,500 |
Source: Public Records
Map
Nearby Homes
- 55 Allen St
- 19 Manor Ct Unit 19
- 49 Corcoran Blvd
- 125 Manor Ct Unit 125
- 647 Plumtree Rd
- 509 Plumtree Rd
- 37 Chesterfield Ave
- 17 Pebble Mill Rd
- 47 Hartford Terrace
- 86 Talmadge Dr
- 206 Treetop Ave
- 119 Powell Ave
- 85 Talmadge Dr
- 7 Ashbrook St
- 75 Gillette Cir
- 24 Wands St
- 79 Roosevelt Ave
- 46 Hadley St
- 384 Abbott St
- 1088 Sumner Ave
Your Personal Tour Guide
Ask me questions while you tour the home.