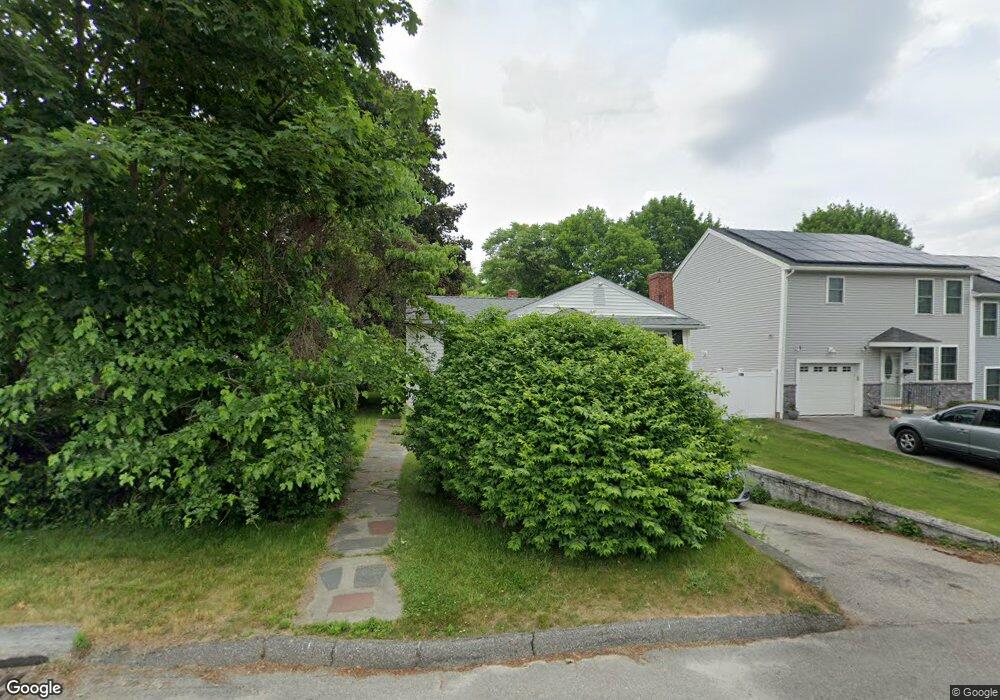
61 Kenberma Rd Worcester, MA 01604
Union HIll NeighborhoodEstimated Value: $340,756 - $390,000
2
Beds
1
Bath
916
Sq Ft
$400/Sq Ft
Est. Value
About This Home
This home is located at 61 Kenberma Rd, Worcester, MA 01604 and is currently estimated at $366,189, approximately $399 per square foot. 61 Kenberma Rd is a home located in Worcester County with nearby schools including Jacob Hiatt Magnet School, Chandler Magnet, and Rice Square Elementary School.
Ownership History
Date
Name
Owned For
Owner Type
Purchase Details
Closed on
Dec 21, 2011
Sold by
Kelly Michelle A
Bought by
Kenberma Road Irt and Kelly Michelle A
Current Estimated Value
Purchase Details
Closed on
Jun 16, 2006
Sold by
Joy Martha T and Archibald Patricia
Bought by
Kelly Martin D and Kelly Michelle A
Home Financials for this Owner
Home Financials are based on the most recent Mortgage that was taken out on this home.
Original Mortgage
$176,000
Interest Rate
6.62%
Mortgage Type
Purchase Money Mortgage
Create a Home Valuation Report for This Property
The Home Valuation Report is an in-depth analysis detailing your home's value as well as a comparison with similar homes in the area
Home Values in the Area
Average Home Value in this Area
Purchase History
| Date | Buyer | Sale Price | Title Company |
|---|---|---|---|
| Kenberma Road Irt | -- | -- | |
| Kelly Michelle A | -- | -- | |
| Kelly Martin D | $220,000 | -- |
Source: Public Records
Mortgage History
| Date | Status | Borrower | Loan Amount |
|---|---|---|---|
| Previous Owner | Kelly Martin D | $176,000 |
Source: Public Records
Tax History
| Year | Tax Paid | Tax Assessment Tax Assessment Total Assessment is a certain percentage of the fair market value that is determined by local assessors to be the total taxable value of land and additions on the property. | Land | Improvement |
|---|---|---|---|---|
| 2025 | $4,041 | $306,400 | $118,700 | $187,700 |
| 2024 | $3,983 | $289,700 | $118,700 | $171,000 |
| 2023 | $3,824 | $266,700 | $103,200 | $163,500 |
| 2022 | $3,375 | $221,900 | $82,600 | $139,300 |
| 2021 | $3,240 | $199,000 | $66,100 | $132,900 |
| 2020 | $3,135 | $184,400 | $66,100 | $118,300 |
| 2019 | $2,950 | $163,900 | $59,500 | $104,400 |
| 2018 | $2,882 | $152,400 | $59,500 | $92,900 |
| 2017 | $2,881 | $149,900 | $59,500 | $90,400 |
| 2016 | $2,751 | $133,500 | $43,700 | $89,800 |
| 2015 | $2,679 | $133,500 | $43,700 | $89,800 |
| 2014 | $2,609 | $133,500 | $43,700 | $89,800 |
Source: Public Records
Map
Nearby Homes
- 5 Everton Ave
- 41 Bridgeport St
- 32 Granite St
- 83 Massasoit Rd
- 429 Grafton St Unit 2
- 20 Brightwood Ave
- 59 Barclay St
- 49 South St
- 62 Allston Ave
- 26 South St
- 20 Bolton St
- 57 Cutler St
- 15 Houghton St Unit 9
- 9 Winthrop St
- 21 Mott St
- 112 Harrison St
- 143 Dorcester
- 9 Barclay St
- 17 Fairbanks St
- 16 Arborwood Dr
- 49 Kenberma Rd
- 63 Kenberma Rd
- 104 Heywood St
- 102 Heywood St
- 65 Kenberma Rd
- 47 Kenberma Rd
- 47 Kenberma Rd Unit 1
- 100 Heywood St
- 64 Kenberma Rd
- 108 Heywood St
- 108 Heywood St Unit 2
- 98 Heywood St
- 56 Kenberma Rd
- 4 Dearborn St
- 110 Heywood St
- 66 Kenberma Rd
- 45 Kenberma Rd
- 96 Heywood St
- 72 Kenberma Rd
- 72 Kenberma Rd
Your Personal Tour Guide
Ask me questions while you tour the home.