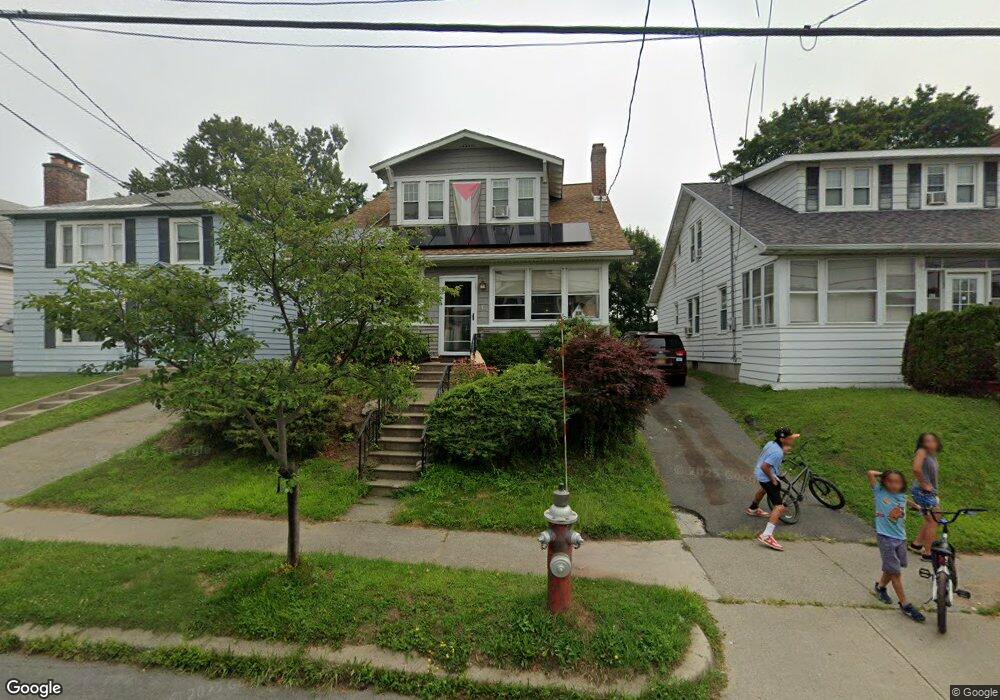
61 Kent St Albany, NY 12206
Beverwyck NeighborhoodEstimated Value: $244,000 - $319,622
4
Beds
2
Baths
1,968
Sq Ft
$143/Sq Ft
Est. Value
About This Home
This home is located at 61 Kent St, Albany, NY 12206 and is currently estimated at $282,156, approximately $143 per square foot. 61 Kent St is a home located in Albany County with nearby schools including Stephen And Harriet Myers Middle School, Albany High School, and Roots Academy at West Hill.
Ownership History
Date
Name
Owned For
Owner Type
Purchase Details
Closed on
Apr 16, 2008
Sold by
Shine Rhondine A
Bought by
George Cylon A
Current Estimated Value
Home Financials for this Owner
Home Financials are based on the most recent Mortgage that was taken out on this home.
Original Mortgage
$154,200
Outstanding Balance
$98,340
Interest Rate
6.1%
Mortgage Type
New Conventional
Estimated Equity
$183,816
Purchase Details
Closed on
Dec 16, 2005
Sold by
Carl Wm E
Bought by
Shine Rhondine A
Home Financials for this Owner
Home Financials are based on the most recent Mortgage that was taken out on this home.
Original Mortgage
$131,100
Interest Rate
6.16%
Create a Home Valuation Report for This Property
The Home Valuation Report is an in-depth analysis detailing your home's value as well as a comparison with similar homes in the area
Home Values in the Area
Average Home Value in this Area
Purchase History
| Date | Buyer | Sale Price | Title Company |
|---|---|---|---|
| George Cylon A | $159,000 | Nicholas Criscione | |
| George Cylon A | $159,000 | None Available | |
| Shine Rhondine A | $138,000 | Rob Tecler | |
| Shine Rhondine A | $138,000 | Wtr Title Insurance |
Source: Public Records
Mortgage History
| Date | Status | Borrower | Loan Amount |
|---|---|---|---|
| Open | George Cylon A | $154,200 | |
| Closed | George Cylon A | $154,200 | |
| Previous Owner | Shine Rhondine A | $131,100 |
Source: Public Records
Tax History Compared to Growth
Tax History
| Year | Tax Paid | Tax Assessment Tax Assessment Total Assessment is a certain percentage of the fair market value that is determined by local assessors to be the total taxable value of land and additions on the property. | Land | Improvement |
|---|---|---|---|---|
| 2024 | $7,056 | $281,000 | $56,200 | $224,800 |
| 2023 | $5,241 | $144,000 | $29,000 | $115,000 |
| 2022 | $2,237 | $144,000 | $29,000 | $115,000 |
| 2021 | $4,995 | $144,000 | $29,000 | $115,000 |
| 2020 | $4,826 | $144,000 | $29,000 | $115,000 |
| 2019 | $5,669 | $144,000 | $29,000 | $115,000 |
| 2018 | $4,827 | $144,000 | $29,000 | $115,000 |
| 2017 | $2,090 | $144,000 | $29,000 | $115,000 |
| 2016 | $4,687 | $144,000 | $29,000 | $115,000 |
| 2015 | $4,776 | $147,700 | $29,500 | $118,200 |
| 2014 | -- | $147,700 | $29,500 | $118,200 |
Source: Public Records
Map
Nearby Homes