Estimated Value: $760,000 - $879,470
4
Beds
3
Baths
2,122
Sq Ft
$391/Sq Ft
Est. Value
About This Home
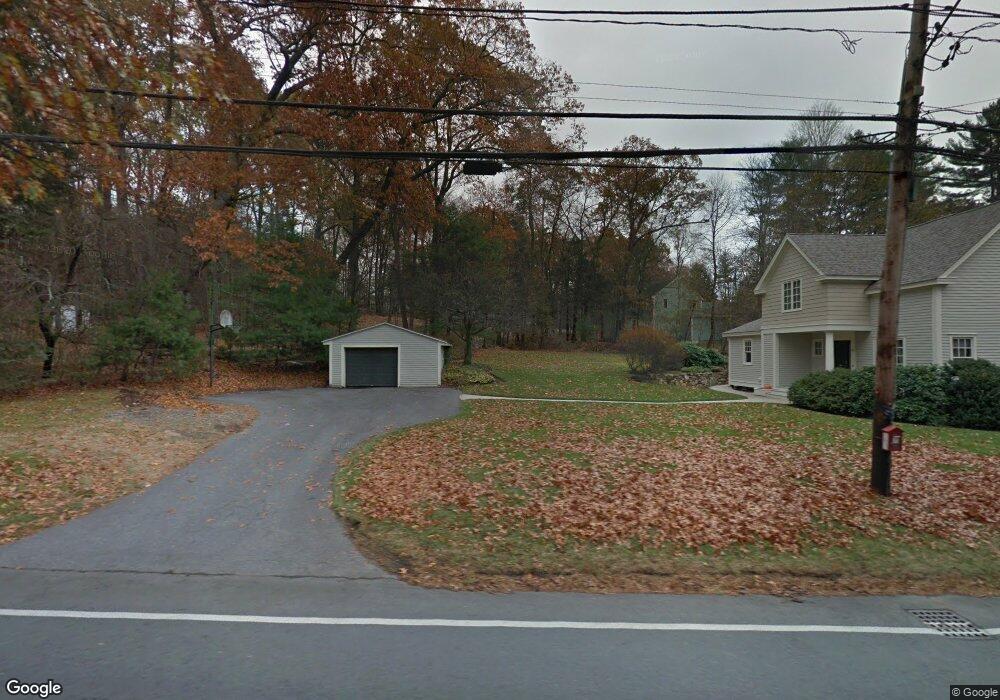
This home is located at 61 Main St, Acton, MA 01720 and is currently estimated at $830,118, approximately $391 per square foot. 61 Main St is a home located in Middlesex County with nearby schools including Acton-Boxborough Regional High School, Maynard Knowledge Beginnings, and The Imago School.
Ownership History
Date
Name
Owned For
Owner Type
Purchase Details
Closed on
Dec 18, 1992
Sold by
Lunn & Sweeney Corp
Bought by
Lasker Gary M and Blanco Carol E
Current Estimated Value
Create a Home Valuation Report for This Property
The Home Valuation Report is an in-depth analysis detailing your home's value as well as a comparison with similar homes in the area
Home Values in the Area
Average Home Value in this Area
Purchase History
| Date | Buyer | Sale Price | Title Company |
|---|---|---|---|
| Lasker Gary M | $229,900 | -- |
Source: Public Records
Mortgage History
| Date | Status | Borrower | Loan Amount |
|---|---|---|---|
| Open | Lasker Gary M | $414,000 | |
| Closed | Lasker Gary M | $417,000 | |
| Closed | Lasker Gary M | $50,000 |
Source: Public Records
Tax History
| Year | Tax Paid | Tax Assessment Tax Assessment Total Assessment is a certain percentage of the fair market value that is determined by local assessors to be the total taxable value of land and additions on the property. | Land | Improvement |
|---|---|---|---|---|
| 2025 | $13,758 | $802,200 | $291,800 | $510,400 |
| 2024 | $13,329 | $799,600 | $291,800 | $507,800 |
| 2023 | $13,014 | $741,100 | $265,200 | $475,900 |
| 2022 | $12,294 | $632,100 | $230,400 | $401,700 |
| 2021 | $12,015 | $593,900 | $213,500 | $380,400 |
| 2020 | $11,494 | $597,400 | $213,500 | $383,900 |
| 2019 | $10,810 | $558,100 | $213,500 | $344,600 |
| 2018 | $10,607 | $547,300 | $213,500 | $333,800 |
| 2017 | $10,329 | $541,900 | $213,500 | $328,400 |
| 2016 | $10,248 | $532,900 | $213,500 | $319,400 |
| 2015 | $9,828 | $515,900 | $202,900 | $313,000 |
| 2014 | $9,443 | $485,500 | $202,900 | $282,600 |
Source: Public Records
Map
Nearby Homes
- 40 High St
- 30 Brewster Ln
- 131 Main St
- 129 Main St Unit 129
- 63 Conant St
- 25 Nylander Way
- 70 River St
- 71 Liberty St
- 1 Vanderbelt Rd
- 184 Main St Unit 3
- 36 Brown St
- 7 Hillcrest Dr
- 128 Parker St Unit 3B
- 1 Drummer Rd Unit A5
- 12 Brown St
- 31 Drummer Rd Unit 31
- 7 Kelley Rd
- 70 Powder Mill Rd
- 68 Powder Mill Rd
- 66 Powder Mill Rd
Your Personal Tour Guide
Ask me questions while you tour the home.