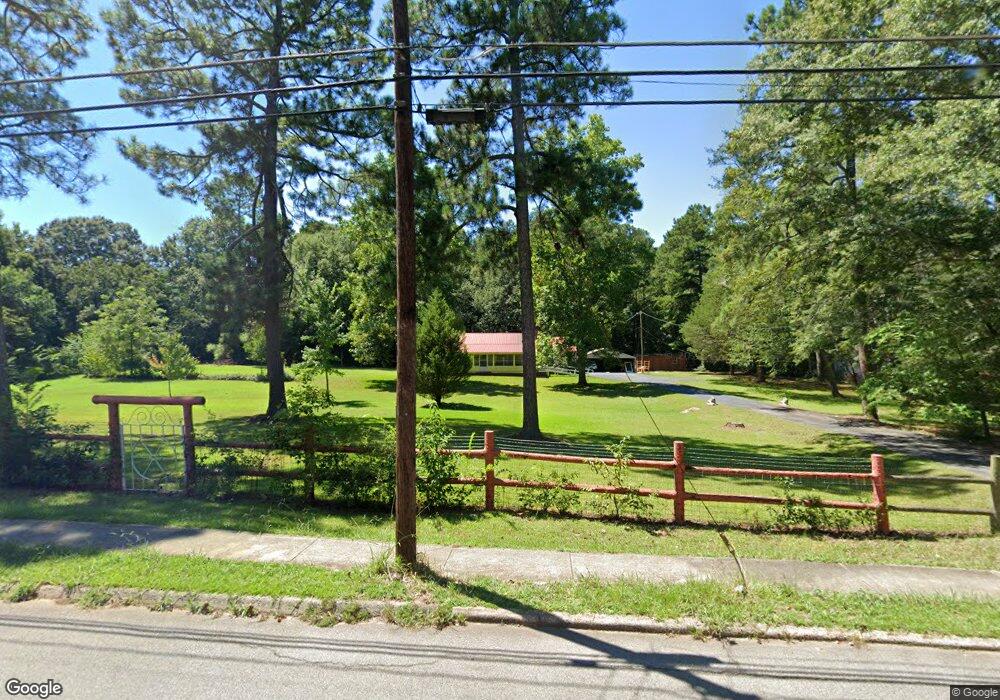
61 N Barnard Ave Lagrange, GA 30241
Estimated Value: $220,000 - $246,000
3
Beds
2
Baths
1,672
Sq Ft
$137/Sq Ft
Est. Value
About This Home
This home is located at 61 N Barnard Ave, Lagrange, GA 30241 and is currently estimated at $228,541, approximately $136 per square foot. 61 N Barnard Ave is a home located in Troup County with nearby schools including Callaway Elementary School, Hogansville Elementary School, and Callaway Middle School.
Ownership History
Date
Name
Owned For
Owner Type
Purchase Details
Closed on
Jul 31, 2020
Sold by
Lummus Patricia Elaine Lassette
Bought by
Key Cody Wayne
Current Estimated Value
Home Financials for this Owner
Home Financials are based on the most recent Mortgage that was taken out on this home.
Original Mortgage
$142,373
Outstanding Balance
$125,439
Interest Rate
3%
Mortgage Type
FHA
Estimated Equity
$103,102
Purchase Details
Closed on
Dec 20, 2019
Sold by
Executo Lummus Patricia Elaine Lassetter
Bought by
Lummus Patricia Elaine Lassette and Crankshaw Elizabeth Jean Lassetter
Purchase Details
Closed on
Oct 31, 2005
Sold by
Asher Frances H
Bought by
Adams Lois R
Purchase Details
Closed on
May 8, 2002
Sold by
Arthur Lewis Harry
Bought by
Frances H Asher
Purchase Details
Closed on
Jan 1, 1972
Sold by
Mills Dunson
Bought by
Arthur Lewis Harry
Create a Home Valuation Report for This Property
The Home Valuation Report is an in-depth analysis detailing your home's value as well as a comparison with similar homes in the area
Purchase History
| Date | Buyer | Sale Price | Title Company |
|---|---|---|---|
| Key Cody Wayne | $145,000 | -- | |
| Lummus Patricia Elaine Lassette | -- | -- | |
| Adams Lois R | $130,000 | -- | |
| Frances H Asher | -- | -- | |
| Arthur Lewis Harry | -- | -- |
Source: Public Records
Mortgage History
| Date | Status | Borrower | Loan Amount |
|---|---|---|---|
| Open | Key Cody Wayne | $142,373 |
Source: Public Records
Tax History
| Year | Tax Paid | Tax Assessment Tax Assessment Total Assessment is a certain percentage of the fair market value that is determined by local assessors to be the total taxable value of land and additions on the property. | Land | Improvement |
|---|---|---|---|---|
| 2025 | $1,933 | $70,864 | $13,440 | $57,424 |
| 2024 | $1,839 | $67,424 | $13,440 | $53,984 |
| 2023 | $1,717 | $62,944 | $13,440 | $49,504 |
| 2022 | $1,685 | $60,384 | $13,440 | $46,944 |
| 2021 | $1,719 | $57,008 | $13,440 | $43,568 |
| 2020 | $1,446 | $47,928 | $13,440 | $34,488 |
| 2019 | $810 | $36,808 | $9,200 | $27,608 |
| 2018 | $790 | $36,152 | $9,200 | $26,952 |
| 2017 | $790 | $36,152 | $9,200 | $26,952 |
| 2016 | $765 | $35,316 | $9,200 | $26,116 |
| 2015 | $766 | $35,316 | $9,200 | $26,116 |
| 2014 | $724 | $33,941 | $9,200 | $24,741 |
| 2013 | -- | $35,506 | $9,200 | $26,306 |
Source: Public Records
Map
Nearby Homes
- 212 Cleveland Dr
- 204 Cleveland Dr
- 115 Clara Jean Ct
- 0 N Barnard Ave
- 110 Lenox Cir
- 107 N Barnard Ave
- 87 Youngs Mill Rd
- 5 Curran Ave
- 101 Sarah Ln
- 412 Sweetwood Ct Unit A36
- 210 Hearthstone Dr
- 224 Rutland Cir
- 304 Bridgette Blvd
- 109 Sarah Ln
- 203 Bonaventure Dr
- 5 Gulfstream Dr
- 3 Gulfstream Dr
- 4 1/2 Barnard Ave
- 146 Shenandoah Ln
- 147 Shenandoah Ln
- 63 N Barnard Ave
- 49 N Barnard Ave
- 65 N Barnard Ave
- 48 N Barnard Ave
- 47 N Barnard Ave
- 302 Athens St
- 77 N Barnard Ave
- 46 N Barnard Ave
- 0 Athens St Unit 7596915
- 44 N Barnard Ave
- 60 N Barnard Ave
- 45 N Barnard Ave
- 134 Clara Jean Ct
- 132 Clara Jean Ct
- 310 Cleveland Dr
- 66 N Barnard Ave
- 304 Cleveland Dr
- 81 N Barnard Ave
- 302 Cleveland Dr
- 128 Clara Jean Ct
Your Personal Tour Guide
Ask me questions while you tour the home.