
61 N Main St Assonet, MA 02702
Assonet NeighborhoodHighlights
- 101,495 Sq Ft lot
- 2 Fireplaces
- Jogging Path
- Property is near public transit
- No HOA
- Patio
About This Home
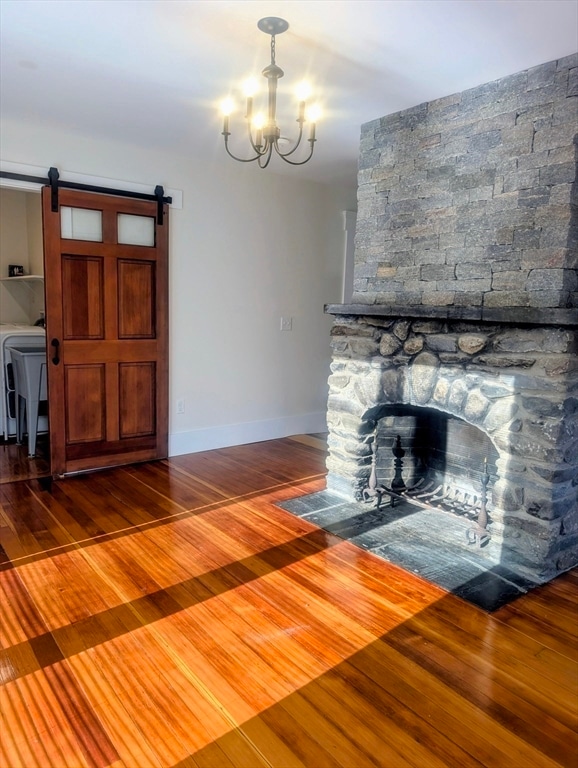
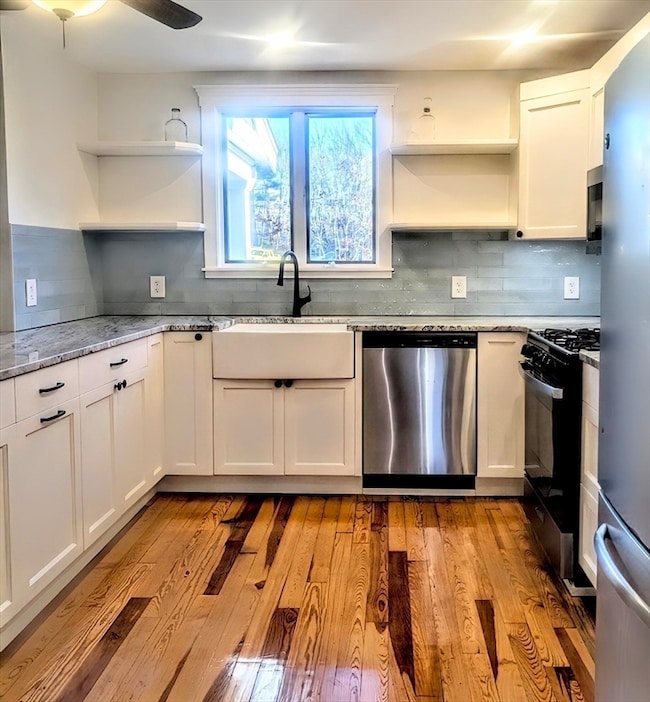
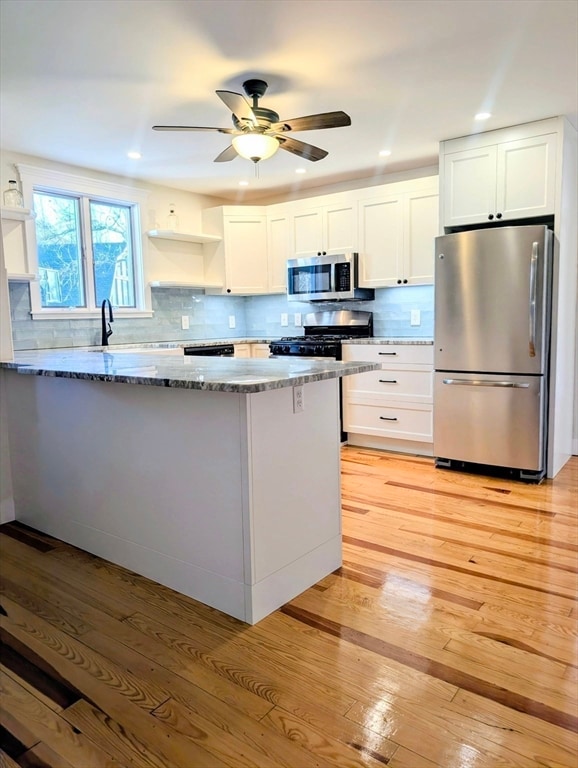
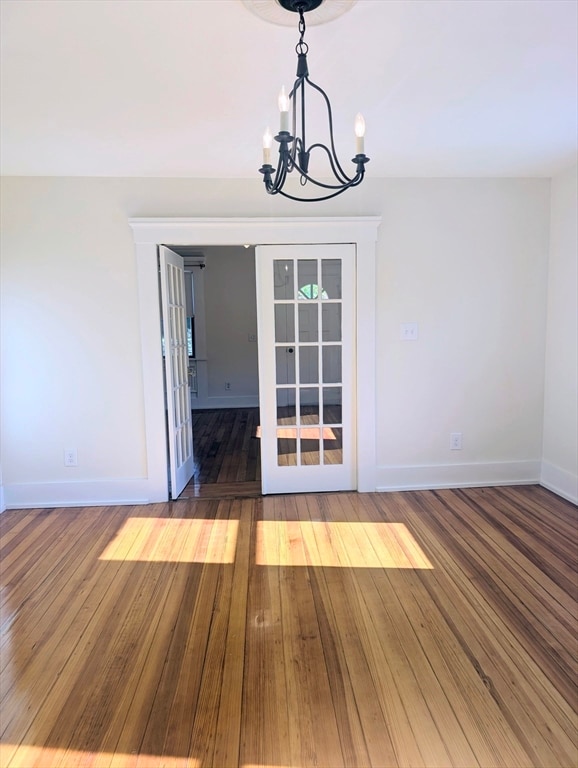
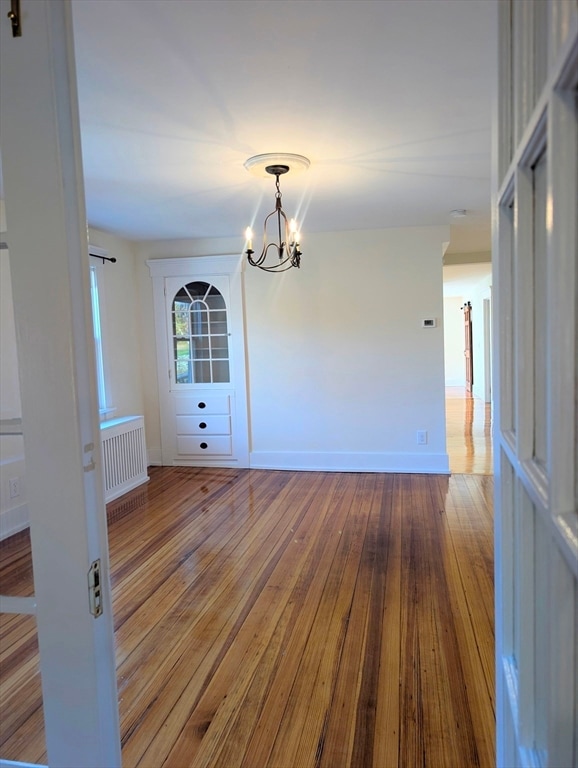
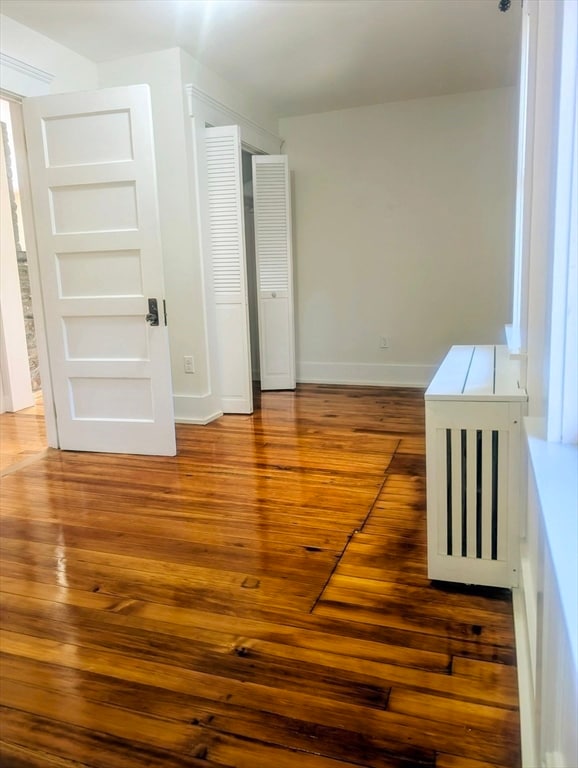
Spacious 2 PLUS huge office (larger than bedrooms) and a den! Recently renovated from top to bottom. The modern kitchen is a showstopper, featuring gorgeous cabinets, stone countertops, a farmhouse sink, and a beautiful backsplash. Gleaming hardwood floors run throughout, and you get incredible living flexibility: enjoy two family rooms, a dedicated den/office, or convert one space to a formal dining area—many options available! Character details include French doors, original built-ins, and stylish shiplap accents. Open the door to your private patio, the perfect spot for morning coffee or evening relaxation. Commuting is a breeze, located close to Route 24 and just minutes from the Freetown MBTA station. Unbeatable value -- WIFI and GAS is INCLUDED (for heat, hot water and cooking!), plus off-street parking and generator backup. The laundry room includes a full-size washer/dryer, utility sink, and storage is available for bikes, kayaks etc. This isn't just a rental—it's an oasis!
Property Details
Home Type
- Multi-Family
Est. Annual Taxes
- $3,428
Year Built
- 1880
Lot Details
- 2.33 Acre Lot
- Stone Wall
Parking
- 2 Car Parking Spaces
Home Design
- Apartment
- Entry on the 1st floor
Interior Spaces
- 1,750 Sq Ft Home
- 1-Story Property
- 2 Fireplaces
- Laundry in unit
Bedrooms and Bathrooms
- 2 Bedrooms
- 1 Full Bathroom
Utilities
- No Cooling
- Heating System Uses Natural Gas
- Heating System Uses Propane
Additional Features
- Patio
- Property is near public transit
Listing and Financial Details
- Security Deposit $2,950
- Rent includes heat, hot water, gas, water, snow removal, gardener, extra storage, internet
- 12 Month Lease Term
- Assessor Parcel Number M:206 P:7.01,3441102
Community Details
Overview
- No Home Owners Association
Recreation
- Park
- Jogging Path
Pet Policy
- Call for details about the types of pets allowed
Map
Source: MLS Property Information Network (MLS PIN)
MLS Number: 73450423
APN: FREE-000206-000000-000007-000001
Disclaimer: Certain information contained herein is derived from information provided by parties other than Homes.com. All information provided is deemed reliable, but is not guaranteed to be accurate and should be independently verified.
![]() The property listing data and information, or the Images, set forth herein were provided to MLS Property Information Network, Inc. from third party sources, including sellers, lessors and public records, and were compiled by MLS Property Information Network, Inc. The property listing data and information, and the Images, are for the personal, non-commercial use of consumers having a good faith interest in purchasing or leasing listed properties of the type displayed to them and may not be used for any purpose other than to identify prospective properties which such consumers may have a good faith interest in purchasing or leasing. MLS Property Information Network, Inc. and its subscribers disclaim any and all representations and warranties as to the accuracy of the property listing data and information, or as to the accuracy of any of the Images, set forth herein.
The property listing data and information, or the Images, set forth herein were provided to MLS Property Information Network, Inc. from third party sources, including sellers, lessors and public records, and were compiled by MLS Property Information Network, Inc. The property listing data and information, and the Images, are for the personal, non-commercial use of consumers having a good faith interest in purchasing or leasing listed properties of the type displayed to them and may not be used for any purpose other than to identify prospective properties which such consumers may have a good faith interest in purchasing or leasing. MLS Property Information Network, Inc. and its subscribers disclaim any and all representations and warranties as to the accuracy of the property listing data and information, or as to the accuracy of any of the Images, set forth herein.
