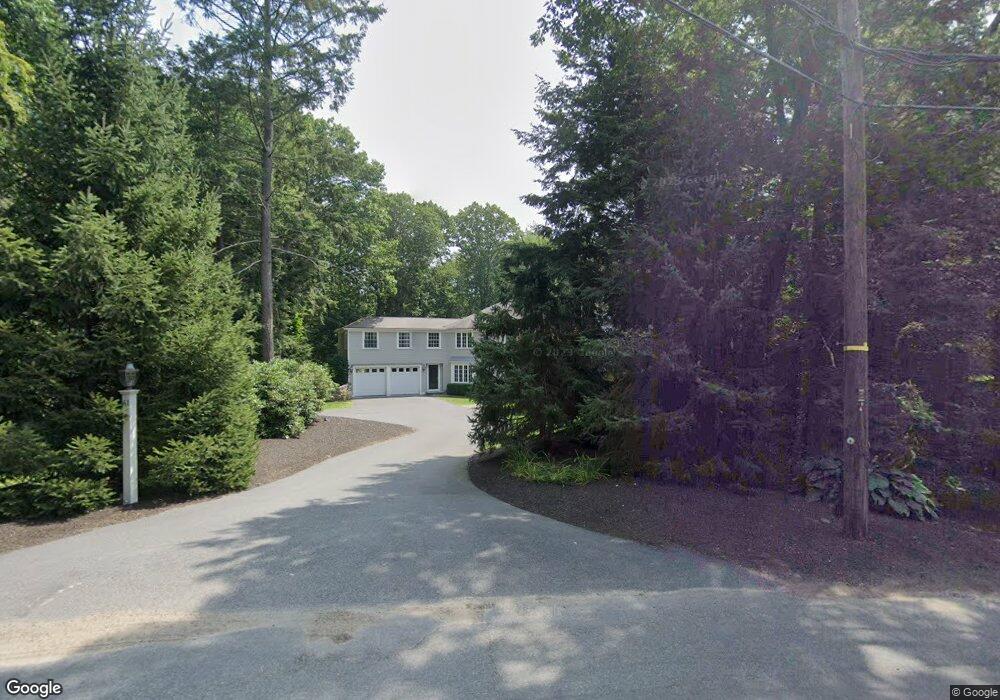
61 Ox Bow Rd Weston, MA 02493
Estimated Value: $2,833,694 - $3,539,000
5
Beds
6
Baths
4,208
Sq Ft
$739/Sq Ft
Est. Value
About This Home
This home is located at 61 Ox Bow Rd, Weston, MA 02493 and is currently estimated at $3,110,674, approximately $739 per square foot. 61 Ox Bow Rd is a home located in Middlesex County with nearby schools including Country Elementary School, Woodland Elementary School, and Weston Middle School.
Ownership History
Date
Name
Owned For
Owner Type
Purchase Details
Closed on
Mar 16, 2022
Sold by
Connolly Paul K
Bought by
P K Connolly Jr 2006 Ret
Current Estimated Value
Purchase Details
Closed on
Apr 19, 1983
Bought by
Connolly Paul K
Create a Home Valuation Report for This Property
The Home Valuation Report is an in-depth analysis detailing your home's value as well as a comparison with similar homes in the area
Home Values in the Area
Average Home Value in this Area
Purchase History
| Date | Buyer | Sale Price | Title Company |
|---|---|---|---|
| P K Connolly Jr 2006 Ret | -- | None Available | |
| Connolly Paul K | $275,000 | -- |
Source: Public Records
Mortgage History
| Date | Status | Borrower | Loan Amount |
|---|---|---|---|
| Previous Owner | Connolly Paul K | $216,000 | |
| Previous Owner | Connolly Paul K | $220,000 | |
| Previous Owner | Connolly Paul K | $225,000 |
Source: Public Records
Tax History Compared to Growth
Tax History
| Year | Tax Paid | Tax Assessment Tax Assessment Total Assessment is a certain percentage of the fair market value that is determined by local assessors to be the total taxable value of land and additions on the property. | Land | Improvement |
|---|---|---|---|---|
| 2025 | $26,225 | $2,362,600 | $1,267,200 | $1,095,400 |
| 2024 | $25,725 | $2,313,400 | $1,267,200 | $1,046,200 |
| 2023 | $25,944 | $2,191,200 | $1,267,200 | $924,000 |
| 2022 | $25,576 | $1,996,600 | $1,202,000 | $794,600 |
| 2021 | $24,710 | $1,903,700 | $1,146,800 | $756,900 |
| 2020 | $23,774 | $1,853,000 | $1,146,800 | $706,200 |
| 2019 | $23,259 | $1,847,400 | $1,146,800 | $700,600 |
| 2018 | $23,157 | $1,851,100 | $1,146,800 | $704,300 |
| 2017 | $22,954 | $1,851,100 | $1,146,800 | $704,300 |
| 2016 | $22,509 | $1,851,100 | $1,146,800 | $704,300 |
| 2015 | $21,872 | $1,781,100 | $1,097,000 | $684,100 |
Source: Public Records
Map
Nearby Homes
- 8 Old Town Rd
- 135 Orchard Ave
- 25 Columbia St
- 52 Valley Rd
- 3 Ravine Rd
- 41 Orchard Ave
- 54 Colburn Rd
- 7 Crescent St
- 23 Stonecroft Cir
- 12 Bird Hill Ave
- 2 Longfellow Rd
- 200 Cliff Rd
- 45 Moulton St
- 20 Oakland Street Front
- 17 Deforest Rd
- 35 Albion Rd
- 7 Cliff Rd
- 6 Oakland Cir
- 100 Westcliff Rd
- 99 Old Colony Rd