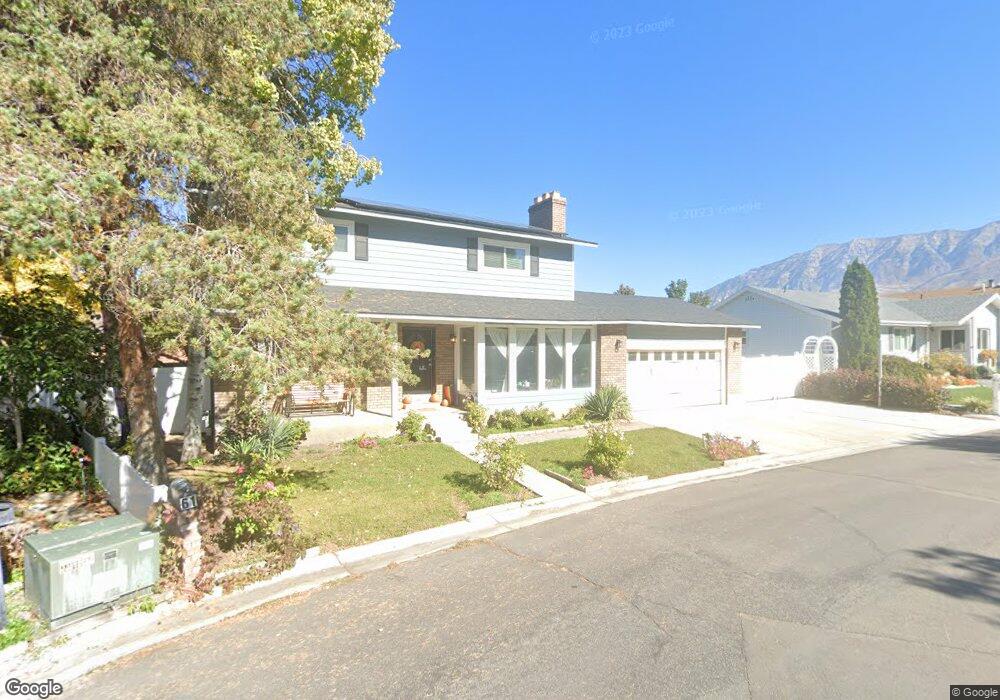
61 Park Ln N Orem, UT 84058
Cherry Hill NeighborhoodEstimated Value: $565,303 - $633,000
5
Beds
4
Baths
2,636
Sq Ft
$227/Sq Ft
Est. Value
About This Home
This home is located at 61 Park Ln N, Orem, UT 84058 and is currently estimated at $597,101, approximately $226 per square foot. 61 Park Ln N is a home located in Utah County with nearby schools including Cherry Hill Elementary School, Lakeridge Jr High School, and Mountain View High School.
Ownership History
Date
Name
Owned For
Owner Type
Purchase Details
Closed on
Dec 6, 2016
Sold by
Marx Ronald J and Marx Tabitha A
Bought by
Spence Logan and Spence Camille
Current Estimated Value
Home Financials for this Owner
Home Financials are based on the most recent Mortgage that was taken out on this home.
Original Mortgage
$292,602
Outstanding Balance
$234,280
Interest Rate
3.25%
Mortgage Type
FHA
Estimated Equity
$362,821
Purchase Details
Closed on
Apr 11, 1997
Sold by
Marx Ronald J
Bought by
Marx Ronald J and Marx Tabitha A
Home Financials for this Owner
Home Financials are based on the most recent Mortgage that was taken out on this home.
Original Mortgage
$142,500
Interest Rate
7.86%
Create a Home Valuation Report for This Property
The Home Valuation Report is an in-depth analysis detailing your home's value as well as a comparison with similar homes in the area
Home Values in the Area
Average Home Value in this Area
Purchase History
| Date | Buyer | Sale Price | Title Company |
|---|---|---|---|
| Spence Logan | -- | Eagle Gate Title Ins Ag | |
| Marx Ronald J | -- | First American Title |
Source: Public Records
Mortgage History
| Date | Status | Borrower | Loan Amount |
|---|---|---|---|
| Open | Spence Logan | $292,602 | |
| Previous Owner | Marx Ronald J | $142,500 |
Source: Public Records
Tax History
| Year | Tax Paid | Tax Assessment Tax Assessment Total Assessment is a certain percentage of the fair market value that is determined by local assessors to be the total taxable value of land and additions on the property. | Land | Improvement |
|---|---|---|---|---|
| 2025 | $2,189 | $276,320 | -- | -- |
| 2024 | $2,189 | $267,630 | $0 | $0 |
| 2023 | $2,042 | $268,400 | $0 | $0 |
| 2022 | $2,015 | $256,520 | $0 | $0 |
| 2021 | $1,866 | $359,900 | $125,300 | $234,600 |
| 2020 | $1,731 | $328,000 | $100,200 | $227,800 |
| 2019 | $1,597 | $314,700 | $86,900 | $227,800 |
| 2018 | $1,495 | $281,600 | $83,500 | $198,100 |
| 2017 | $1,358 | $137,005 | $0 | $0 |
| 2016 | $1,281 | $119,130 | $0 | $0 |
| 2015 | $1,232 | $108,405 | $0 | $0 |
| 2014 | $1,114 | $97,570 | $0 | $0 |
Source: Public Records
Map
Nearby Homes
Your Personal Tour Guide
Ask me questions while you tour the home.