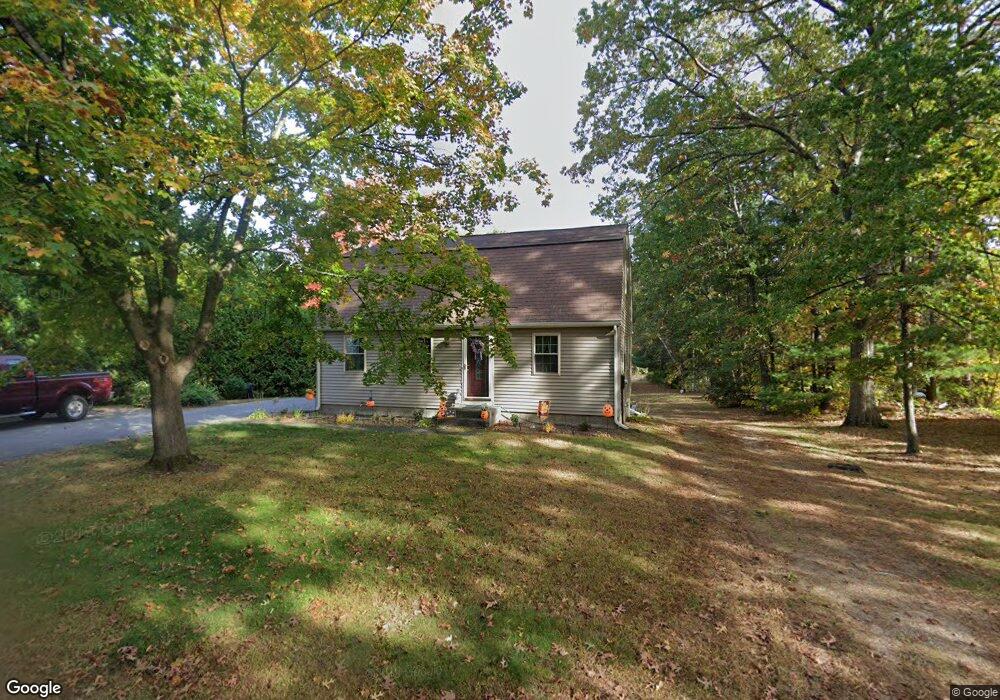
61 Phelps St Easthampton, MA 01027
Estimated Value: $357,000 - $386,000
3
Beds
2
Baths
1,536
Sq Ft
$242/Sq Ft
Est. Value
About This Home
This home is located at 61 Phelps St, Easthampton, MA 01027 and is currently estimated at $371,097, approximately $241 per square foot. 61 Phelps St is a home located in Hampshire County with nearby schools including Easthampton High School, Calvary Baptist Christian School, and Tri-County Schools.
Ownership History
Date
Name
Owned For
Owner Type
Purchase Details
Closed on
Feb 4, 1992
Sold by
Lesson John W and Lesson Constance T
Bought by
Girard Ronald R and Girard Jacqueline M
Current Estimated Value
Home Financials for this Owner
Home Financials are based on the most recent Mortgage that was taken out on this home.
Original Mortgage
$87,581
Interest Rate
8.44%
Mortgage Type
VA
Create a Home Valuation Report for This Property
The Home Valuation Report is an in-depth analysis detailing your home's value as well as a comparison with similar homes in the area
Home Values in the Area
Average Home Value in this Area
Purchase History
| Date | Buyer | Sale Price | Title Company |
|---|---|---|---|
| Girard Ronald R | $86,500 | -- |
Source: Public Records
Mortgage History
| Date | Status | Borrower | Loan Amount |
|---|---|---|---|
| Closed | Girard Ronald R | $87,581 | |
| Previous Owner | Girard Ronald R | $27,000 | |
| Previous Owner | Girard Ronald R | $18,500 |
Source: Public Records
Tax History
| Year | Tax Paid | Tax Assessment Tax Assessment Total Assessment is a certain percentage of the fair market value that is determined by local assessors to be the total taxable value of land and additions on the property. | Land | Improvement |
|---|---|---|---|---|
| 2025 | $3,981 | $291,200 | $124,600 | $166,600 |
| 2024 | $3,837 | $283,000 | $121,100 | $161,900 |
| 2023 | $2,955 | $201,700 | $95,500 | $106,200 |
| 2022 | $3,334 | $201,700 | $95,500 | $106,200 |
| 2021 | $3,640 | $207,500 | $95,500 | $112,000 |
| 2020 | $3,582 | $201,700 | $95,500 | $106,200 |
| 2019 | $3,083 | $199,400 | $95,500 | $103,900 |
| 2018 | $3,181 | $198,800 | $90,200 | $108,600 |
| 2017 | $3,096 | $191,000 | $86,400 | $104,600 |
| 2016 | $2,978 | $191,000 | $86,400 | $104,600 |
| 2015 | $2,894 | $191,000 | $86,400 | $104,600 |
Source: Public Records
Map
Nearby Homes
Your Personal Tour Guide
Ask me questions while you tour the home.