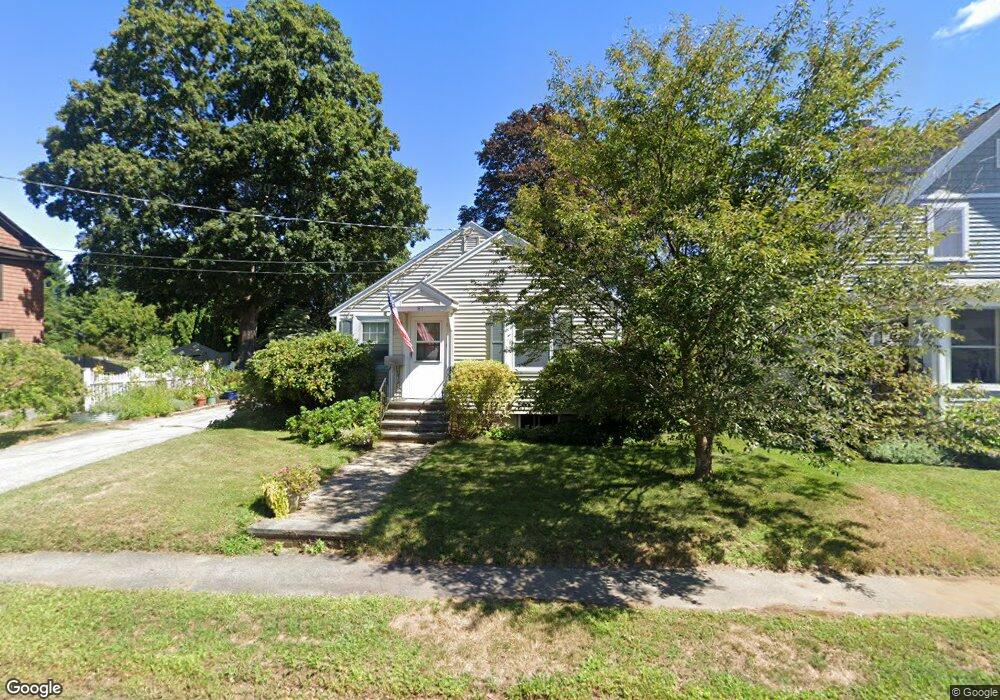
61 Rust St South Hamilton, MA 01982
Estimated Value: $650,000 - $698,059
3
Beds
1
Bath
1,132
Sq Ft
$599/Sq Ft
Est. Value
About This Home
This home is located at 61 Rust St, South Hamilton, MA 01982 and is currently estimated at $678,515, approximately $599 per square foot. 61 Rust St is a home located in Essex County with nearby schools including Winthrop School, Bessie Buker Elementary School, and Cutler Elementary School.
Ownership History
Date
Name
Owned For
Owner Type
Purchase Details
Closed on
May 15, 2007
Sold by
Reynault Josephine A
Bought by
Kennedy Rosemary
Current Estimated Value
Purchase Details
Closed on
Mar 10, 2006
Sold by
Parsons Thomas E
Bought by
Reynault Josephine A
Purchase Details
Closed on
Jun 10, 2004
Sold by
Reynault Frank A
Bought by
Parsons Thomas Edwin
Purchase Details
Closed on
Nov 22, 1999
Sold by
Flanagan John F and Flanagan Donald J
Bought by
Reynault Frank A
Purchase Details
Closed on
May 11, 1999
Sold by
Flanagan Laurie
Bought by
Flanagan John F and Flanagan Donald J
Create a Home Valuation Report for This Property
The Home Valuation Report is an in-depth analysis detailing your home's value as well as a comparison with similar homes in the area
Home Values in the Area
Average Home Value in this Area
Purchase History
| Date | Buyer | Sale Price | Title Company |
|---|---|---|---|
| Kennedy Rosemary | $330,000 | -- | |
| Reynault Josephine A | -- | -- | |
| Parsons Thomas Edwin | -- | -- | |
| Reynault Frank A | $212,000 | -- | |
| Flanagan John F | $65,000 | -- |
Source: Public Records
Mortgage History
| Date | Status | Borrower | Loan Amount |
|---|---|---|---|
| Open | Flanagan John F | $10,000 | |
| Open | Flanagan John F | $244,000 | |
| Closed | Flanagan John F | $260,000 |
Source: Public Records
Tax History Compared to Growth
Tax History
| Year | Tax Paid | Tax Assessment Tax Assessment Total Assessment is a certain percentage of the fair market value that is determined by local assessors to be the total taxable value of land and additions on the property. | Land | Improvement |
|---|---|---|---|---|
| 2025 | $9,374 | $599,000 | $260,200 | $338,800 |
| 2024 | $8,947 | $592,100 | $260,200 | $331,900 |
| 2023 | $8,449 | $517,100 | $240,000 | $277,100 |
| 2022 | $8,464 | $473,400 | $216,300 | $257,100 |
| 2021 | $7,767 | $443,600 | $216,300 | $227,300 |
| 2020 | $7,227 | $425,600 | $217,000 | $208,600 |
| 2019 | $6,852 | $415,800 | $210,700 | $205,100 |
| 2018 | $6,267 | $386,400 | $198,800 | $187,600 |
| 2017 | $6,092 | $362,400 | $185,900 | $176,500 |
| 2016 | $5,956 | $345,300 | $170,500 | $174,800 |
| 2015 | $5,648 | $330,500 | $162,400 | $168,100 |
| 2014 | $5,471 | $314,400 | $165,900 | $148,500 |
Source: Public Records
Map
Nearby Homes