
Seller's Agent in 2021
Ben Faubert
Onshore Realtors
(401) 315-2588
105 in this area
113 Total Sales
A LOT WITH ALL TOWN AMENITIES WITHIN WALKING DISTANCE TO SCHOOLS, TOWN, LIBRARY ETC.
Last Agent to Sell the Property
Mary Krupinski
Compass License #REB.0010502 Listed on: 10/01/2010
| Date | Type | Sale Price | Title Company |
|---|---|---|---|
| Warranty Deed | $385,000 | None Available | |
| Warranty Deed | $289,000 | -- | |
| Deed | $70,000 | -- | |
| Quit Claim Deed | -- | -- | |
| Quit Claim Deed | -- | -- |
| Date | Status | Loan Amount | Loan Type |
|---|---|---|---|
| Open | $308,000 | Purchase Money Mortgage | |
| Previous Owner | $216,750 | Purchase Money Mortgage | |
| Previous Owner | $216,015 | No Value Available | |
| Previous Owner | $1 | No Value Available |
| Date | Event | Price | Change | Sq Ft Price |
|---|---|---|---|---|
| 09/30/2021 09/30/21 | Sold | $385,000 | +1.6% | $260 / Sq Ft |
| 08/31/2021 08/31/21 | Pending | -- | -- | -- |
| 08/17/2021 08/17/21 | For Sale | $379,000 | +31.1% | $256 / Sq Ft |
| 09/09/2019 09/09/19 | Sold | $289,000 | -0.3% | $117 / Sq Ft |
| 08/10/2019 08/10/19 | Pending | -- | -- | -- |
| 07/17/2019 07/17/19 | For Sale | $289,900 | +31.8% | $118 / Sq Ft |
| 03/22/2013 03/22/13 | Sold | $220,000 | -3.9% | $165 / Sq Ft |
| 02/20/2013 02/20/13 | Pending | -- | -- | -- |
| 10/05/2012 10/05/12 | For Sale | $229,000 | +227.1% | $172 / Sq Ft |
| 09/11/2012 09/11/12 | Sold | $70,000 | -29.3% | $65 / Sq Ft |
| 08/12/2012 08/12/12 | Pending | -- | -- | -- |
| 10/01/2010 10/01/10 | For Sale | $99,000 | -- | $91 / Sq Ft |
| Year | Tax Paid | Tax Assessment Tax Assessment Total Assessment is a certain percentage of the fair market value that is determined by local assessors to be the total taxable value of land and additions on the property. | Land | Improvement |
|---|---|---|---|---|
| 2024 | $3,766 | $360,400 | $114,300 | $246,100 |
| 2023 | $3,662 | $360,400 | $114,300 | $246,100 |
| 2022 | $3,640 | $360,400 | $114,300 | $246,100 |
| 2021 | $2,986 | $247,600 | $89,300 | $158,300 |
| 2020 | $2,934 | $247,600 | $89,300 | $158,300 |
| 2019 | $2,907 | $247,600 | $89,300 | $158,300 |
| 2018 | $2,744 | $222,200 | $89,300 | $132,900 |
| 2017 | $2,666 | $222,200 | $89,300 | $132,900 |
| 2016 | $2,666 | $222,200 | $89,300 | $132,900 |
| 2015 | $2,546 | $226,700 | $91,100 | $135,600 |
| 2014 | $2,505 | $226,700 | $91,100 | $135,600 |
Seller's Agent in 2021
Ben Faubert
Onshore Realtors
(401) 315-2588
105 in this area
113 Total Sales
N
Buyer's Agent in 2021
Nicholas Delauro
N
Buyer's Agent in 2021
Nick DeLauro
Onshore Realtors
Seller's Agent in 2019
Sandy Bliven
RE/MAX South County
(401) 714-6359
93 in this area
181 Total Sales
Buyer's Agent in 2019
Liz Andersen Warner
RE/MAX South County
(401) 714-6359
41 in this area
81 Total Sales
E
Buyer's Agent in 2013
Eric Bliven
Coldwell Banker Coastal Homes
Source: State-Wide MLS
MLS Number: 977240
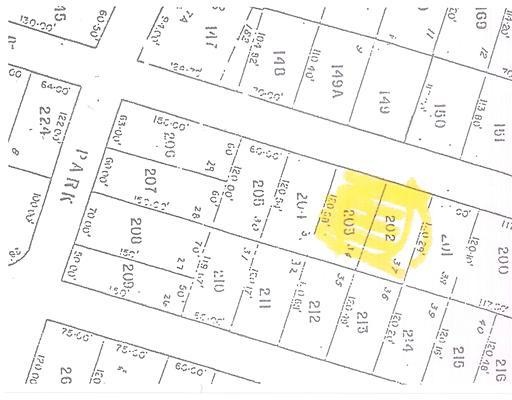
APN: WEST-000057-000202
Disclaimer: Certain information contained herein is derived from information provided by parties other than Homes.com. All information provided is deemed reliable, but is not guaranteed to be accurate and should be independently verified.
![]() IDX information is provided exclusively for personal, non-commercial use, and may not be used for any purpose other than to identify prospective properties consumers may be interested in purchasing. Information is deemed reliable but not guaranteed.
IDX information is provided exclusively for personal, non-commercial use, and may not be used for any purpose other than to identify prospective properties consumers may be interested in purchasing. Information is deemed reliable but not guaranteed.
Copyright © 2025 State-Wide MLS, Inc. All rights reserved.