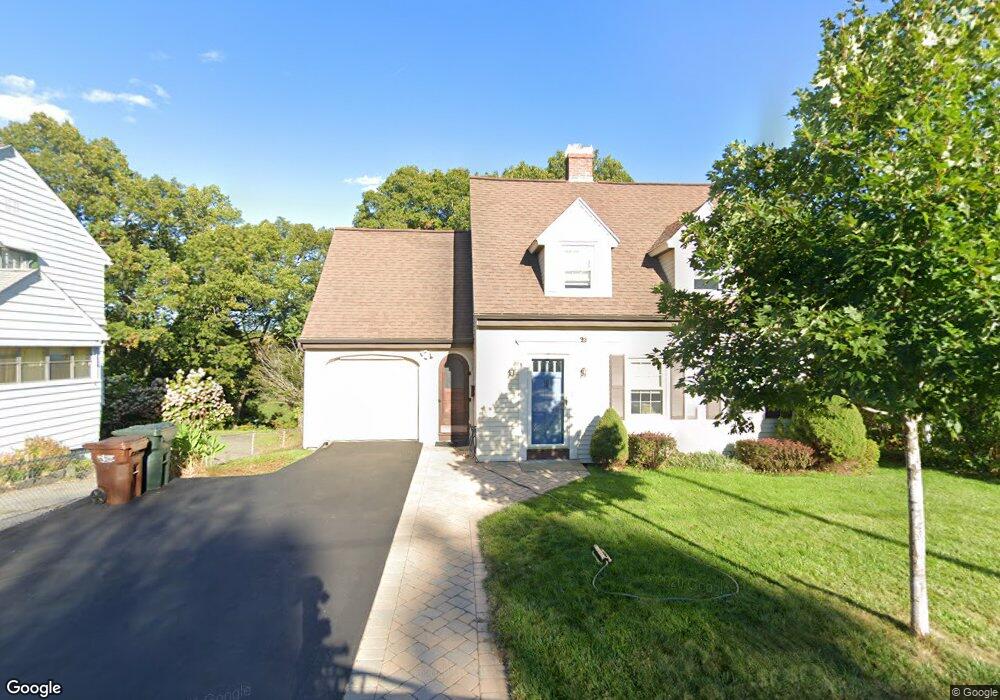
61 Sumner St Auburn, MA 01501
Stoneville NeighborhoodEstimated Value: $427,739 - $471,000
3
Beds
2
Baths
1,413
Sq Ft
$324/Sq Ft
Est. Value
About This Home
This home is located at 61 Sumner St, Auburn, MA 01501 and is currently estimated at $457,185, approximately $323 per square foot. 61 Sumner St is a home located in Worcester County with nearby schools including Auburn Senior High School and Shrewsbury Montessori School - Auburn Campus.
Ownership History
Date
Name
Owned For
Owner Type
Purchase Details
Closed on
Mar 7, 2017
Sold by
Nicholas John Est
Bought by
Maleakas Courtney S
Current Estimated Value
Home Financials for this Owner
Home Financials are based on the most recent Mortgage that was taken out on this home.
Original Mortgage
$103,500
Outstanding Balance
$85,636
Interest Rate
4.09%
Mortgage Type
New Conventional
Estimated Equity
$371,549
Purchase Details
Closed on
Jun 7, 1974
Bought by
Nicholas John
Create a Home Valuation Report for This Property
The Home Valuation Report is an in-depth analysis detailing your home's value as well as a comparison with similar homes in the area
Home Values in the Area
Average Home Value in this Area
Purchase History
| Date | Buyer | Sale Price | Title Company |
|---|---|---|---|
| Maleakas Courtney S | $97,500 | -- | |
| Nicholas John | -- | -- |
Source: Public Records
Mortgage History
| Date | Status | Borrower | Loan Amount |
|---|---|---|---|
| Open | Maleakas Courtney S | $103,500 |
Source: Public Records
Tax History
| Year | Tax Paid | Tax Assessment Tax Assessment Total Assessment is a certain percentage of the fair market value that is determined by local assessors to be the total taxable value of land and additions on the property. | Land | Improvement |
|---|---|---|---|---|
| 2025 | $53 | $370,700 | $115,700 | $255,000 |
| 2024 | $5,299 | $354,900 | $110,700 | $244,200 |
| 2023 | $5,215 | $328,400 | $100,700 | $227,700 |
| 2022 | $4,861 | $289,000 | $100,700 | $188,300 |
| 2021 | $4,617 | $254,500 | $88,900 | $165,600 |
| 2020 | $4,182 | $232,600 | $88,900 | $143,700 |
| 2019 | $4,102 | $222,700 | $88,000 | $134,700 |
| 2018 | $3,889 | $210,900 | $82,300 | $128,600 |
| 2017 | $3,714 | $202,500 | $74,600 | $127,900 |
| 2016 | $3,607 | $199,400 | $77,700 | $121,700 |
| 2015 | $3,419 | $198,100 | $77,700 | $120,400 |
| 2014 | $3,337 | $193,000 | $74,000 | $119,000 |
Source: Public Records
Map
Nearby Homes
- 5 Commonwealth Ave
- 177 Boyce St
- 25 Vinal St Unit 28
- 25 Vinal St Unit 26
- 25 Vinal St Unit 29
- 25 Vinal St Unit 30
- 99 Clover St
- 1 Rockland Road Ct
- 177 Oxford St N
- 204-212 Hampton St
- 31-33 Walsh Ave
- 33 Walsh Ave
- 31 Walsh Ave
- 11 Hulbert Rd Unit 13
- 40 Bryn Mawr Ave
- 19-20 Williams St
- 154 Pakachoag St
- 1034 Southbridge St
- 6 Buron Terrace
- 27 Havana Rd
Your Personal Tour Guide
Ask me questions while you tour the home.