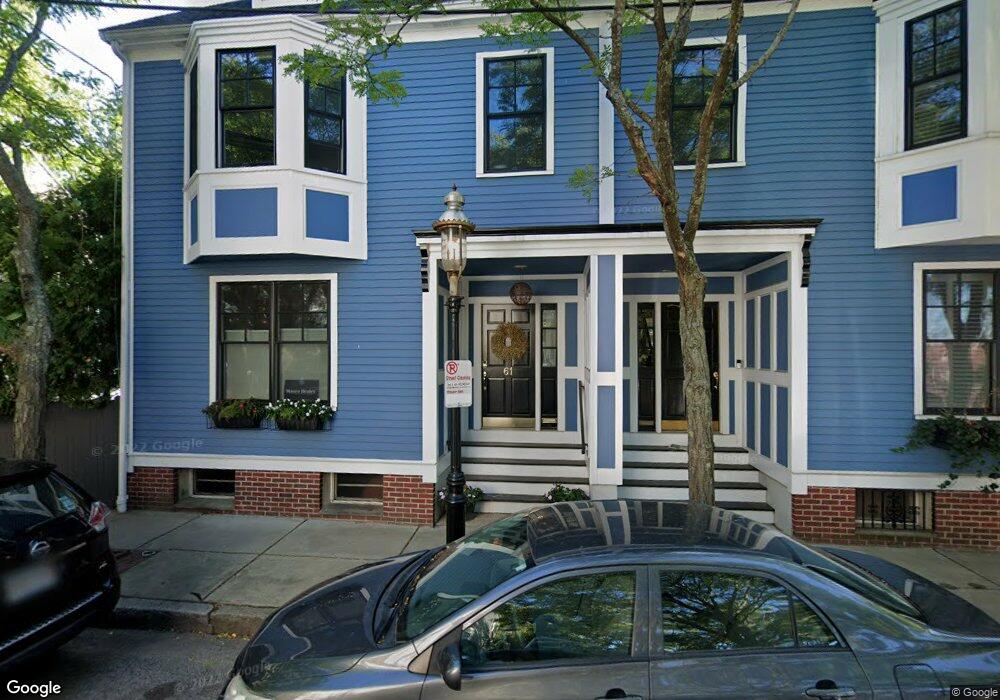
61 Tremont St Charlestown, MA 02129
Thompson Square-Bunker Hill NeighborhoodEstimated Value: $1,816,000 - $2,218,000
3
Beds
3
Baths
1,965
Sq Ft
$1,032/Sq Ft
Est. Value
About This Home
This home is located at 61 Tremont St, Charlestown, MA 02129 and is currently estimated at $2,028,622, approximately $1,032 per square foot. 61 Tremont St is a home located in Suffolk County with nearby schools including Boston Children's School and St John School.
Ownership History
Date
Name
Owned For
Owner Type
Purchase Details
Closed on
Mar 25, 2016
Sold by
Fink Johanna H
Bought by
Johanna H Fink Ret
Current Estimated Value
Purchase Details
Closed on
Aug 18, 2000
Sold by
Frothingham Group Inc
Bought by
Johnson Joanna M
Create a Home Valuation Report for This Property
The Home Valuation Report is an in-depth analysis detailing your home's value as well as a comparison with similar homes in the area
Home Values in the Area
Average Home Value in this Area
Purchase History
| Date | Buyer | Sale Price | Title Company |
|---|---|---|---|
| Johanna H Fink Ret | -- | -- | |
| Johnson Joanna M | $479,000 | -- |
Source: Public Records
Mortgage History
| Date | Status | Borrower | Loan Amount |
|---|---|---|---|
| Previous Owner | Johnson Joanna M | $370,000 | |
| Previous Owner | Johnson Joanna M | $417,000 | |
| Previous Owner | Johnson Joanna M | $479,000 |
Source: Public Records
Tax History Compared to Growth
Tax History
| Year | Tax Paid | Tax Assessment Tax Assessment Total Assessment is a certain percentage of the fair market value that is determined by local assessors to be the total taxable value of land and additions on the property. | Land | Improvement |
|---|---|---|---|---|
| 2025 | $19,907 | $1,719,100 | $491,600 | $1,227,500 |
| 2024 | $17,360 | $1,592,700 | $471,500 | $1,121,200 |
| 2023 | $15,839 | $1,474,800 | $436,600 | $1,038,200 |
| 2022 | $14,587 | $1,340,700 | $396,900 | $943,800 |
| 2021 | $14,305 | $1,340,700 | $396,900 | $943,800 |
| 2020 | $11,972 | $1,133,700 | $367,100 | $766,600 |
| 2019 | $11,719 | $1,111,900 | $294,400 | $817,500 |
| 2018 | $10,890 | $1,039,100 | $294,400 | $744,700 |
| 2017 | $10,686 | $1,009,100 | $294,400 | $714,700 |
| 2016 | $10,000 | $909,100 | $294,400 | $614,700 |
| 2015 | $10,597 | $875,100 | $285,900 | $589,200 |
| 2014 | -- | $780,100 | $285,900 | $494,200 |
Source: Public Records
Map
Nearby Homes
- 106 Bunker Hill St Unit 2
- 106 Bunker Hill St Unit 6
- 106 Bunker Hill St Unit 1
- 106 Bunker Hill St Unit 4P
- 106 Bunker Hill St Unit 3
- 5 Wallace Ct
- 73 Chelsea St Unit 401
- 42 8th St Unit 5316
- 42 8th St Unit 4209
- 42 8th St Unit 4106
- 42 8th St Unit 1201
- 42 8th St Unit 3306
- 42 8th St Unit 2302
- 172 Bunker Hill St Unit 1
- 197 8th St Unit 501
- 197 Eighth St Unit 628
- 197 Eighth St Unit 212
- 17 Henley St Unit F
- 17 Henley St Unit B
- 18R Polk St
- 59 Tremont St
- 63 Tremont St
- 65 Tremont St
- 66 Tremont St
- 57 Tremont St
- 68 Tremont St
- 70 Tremont St
- 55 Tremont St
- 55 Tremont St
- 67 Tremont St
- 67 Tremont St Unit 1
- 72 Tremont St
- 25 Prospect St
- 27 Prospect St
- 21 Prospect St Unit 3
- 21 Prospect St Unit 2
- 21 Prospect St Unit 1
- 21 Prospect St
- 29 Prospect St
- 19 Prospect St Unit 3