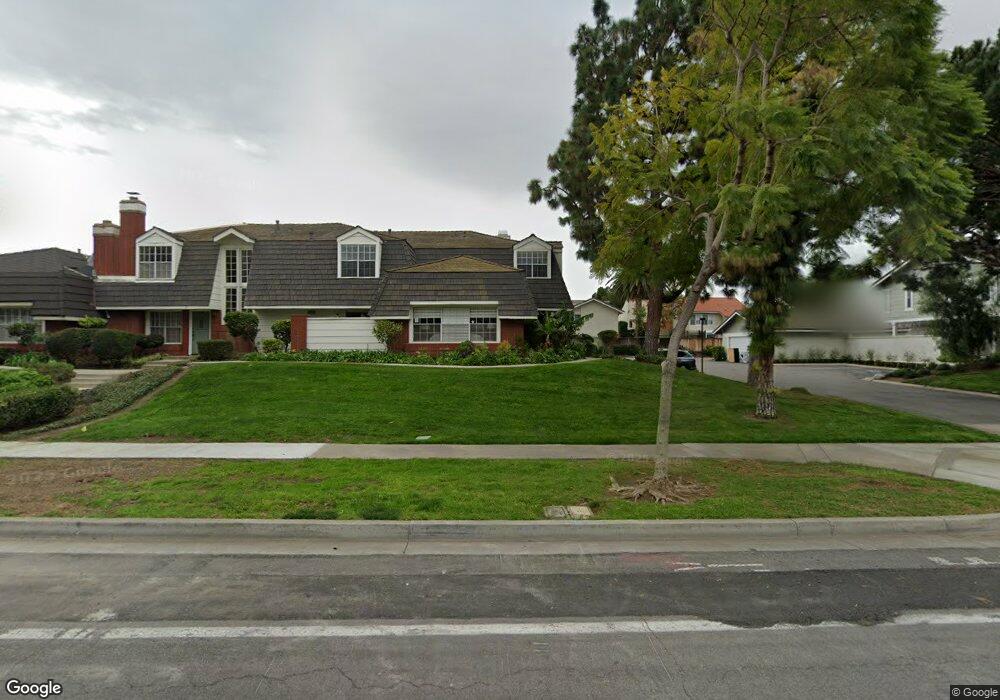
61 W Yale Loop Unit 20 Irvine, CA 92604
Woodbridge NeighborhoodEstimated Value: $1,414,000 - $1,478,000
4
Beds
3
Baths
2,155
Sq Ft
$675/Sq Ft
Est. Value
About This Home
This home is located at 61 W Yale Loop Unit 20, Irvine, CA 92604 and is currently estimated at $1,455,260, approximately $675 per square foot. 61 W Yale Loop Unit 20 is a home located in Orange County with nearby schools including Stone Creek Elementary School, Lakeside Middle School, and Woodbridge High School.
Ownership History
Date
Name
Owned For
Owner Type
Purchase Details
Closed on
Aug 2, 2017
Sold by
Rohanizadeh Bahman and Esfandiari Shida N
Bought by
Rohanizadeh Bahman and Esfandiari Shida E
Current Estimated Value
Home Financials for this Owner
Home Financials are based on the most recent Mortgage that was taken out on this home.
Original Mortgage
$647,282
Outstanding Balance
$536,572
Interest Rate
3.72%
Mortgage Type
FHA
Estimated Equity
$918,688
Purchase Details
Closed on
Apr 8, 1998
Sold by
Home Svgs Of America Fsb
Bought by
Rohanizadeh Bahman and Esfandiari Shida N
Home Financials for this Owner
Home Financials are based on the most recent Mortgage that was taken out on this home.
Original Mortgage
$209,250
Interest Rate
7.06%
Create a Home Valuation Report for This Property
The Home Valuation Report is an in-depth analysis detailing your home's value as well as a comparison with similar homes in the area
Home Values in the Area
Average Home Value in this Area
Purchase History
| Date | Buyer | Sale Price | Title Company |
|---|---|---|---|
| Rohanizadeh Bahman | -- | Pacific Coast Title Company | |
| Rohanizadeh Bahman | $279,000 | Investors Title Company |
Source: Public Records
Mortgage History
| Date | Status | Borrower | Loan Amount |
|---|---|---|---|
| Open | Rohanizadeh Bahman | $647,282 | |
| Closed | Rohanizadeh Bahman | $209,250 | |
| Closed | Rohanizadeh Bahman | $41,800 |
Source: Public Records
Tax History
| Year | Tax Paid | Tax Assessment Tax Assessment Total Assessment is a certain percentage of the fair market value that is determined by local assessors to be the total taxable value of land and additions on the property. | Land | Improvement |
|---|---|---|---|---|
| 2025 | $4,679 | $445,485 | $231,565 | $213,920 |
| 2024 | $4,679 | $436,750 | $227,024 | $209,726 |
| 2023 | $4,557 | $428,187 | $222,573 | $205,614 |
| 2022 | $4,455 | $419,792 | $218,209 | $201,583 |
| 2021 | $4,351 | $411,561 | $213,930 | $197,631 |
| 2020 | $4,326 | $407,341 | $211,736 | $195,605 |
| 2019 | $4,229 | $399,354 | $207,584 | $191,770 |
| 2018 | $4,152 | $391,524 | $203,514 | $188,010 |
| 2017 | $4,065 | $383,848 | $199,524 | $184,324 |
| 2016 | $3,887 | $376,322 | $195,612 | $180,710 |
| 2015 | $3,775 | $370,670 | $192,674 | $177,996 |
| 2014 | $3,701 | $363,410 | $188,900 | $174,510 |
Source: Public Records
Map
Nearby Homes
- 61 W Yale Loop Unit 32
- 61 W Yale Loop
- 59 W Yale Loop
- 63 W Yale Loop Unit 19
- 63 W Yale Loop
- 57 W Yale Loop Unit 22
- 65 W Yale Loop Unit 18
- 55 W Yale Loop
- 67 W Yale Loop
- 83 Nighthawk
- 85 Nighthawk
- 81 Nighthawk
- 53 W Yale Loop Unit 24
- 87 Nighthawk
- 79 Nighthawk
- 52 Westlake
- 56 W Yale Loop Unit 2
- 54 W Yale Loop Unit 3
- 54 W Yale Loop
- 69 W Yale Loop
Your Personal Tour Guide
Ask me questions while you tour the home.