61 Whitney Dr Fremont, OH 43420
Estimated Value: $238,000 - $281,000
3
Beds
2
Baths
1,489
Sq Ft
$169/Sq Ft
Est. Value
About This Home
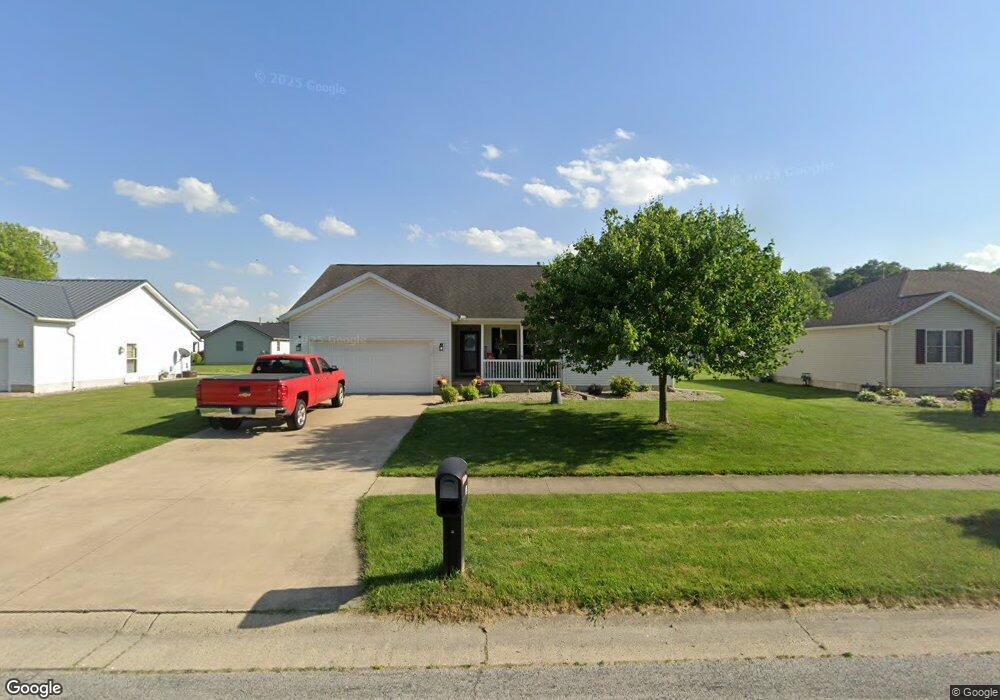
This home is located at 61 Whitney Dr, Fremont, OH 43420 and is currently estimated at $251,717, approximately $169 per square foot. 61 Whitney Dr is a home located in Sandusky County with nearby schools including Fremont Ross High School, Sacred Heart School, and Temple Christian Academy.
Ownership History
Date
Name
Owned For
Owner Type
Purchase Details
Closed on
Dec 22, 2008
Sold by
Federal Home Loan Mortgage Corporation
Bought by
Ellerbrock Cory M and Ellerbrock Sara E
Current Estimated Value
Home Financials for this Owner
Home Financials are based on the most recent Mortgage that was taken out on this home.
Original Mortgage
$129,298
Interest Rate
5.96%
Mortgage Type
FHA
Purchase Details
Closed on
Sep 8, 2008
Sold by
Garcia Erica N
Bought by
Federal Home Loan Mortgage Corp
Purchase Details
Closed on
Apr 24, 2007
Sold by
Clark Corbin W
Bought by
Garcia Erica N
Home Financials for this Owner
Home Financials are based on the most recent Mortgage that was taken out on this home.
Original Mortgage
$170,000
Interest Rate
6.27%
Mortgage Type
Purchase Money Mortgage
Purchase Details
Closed on
May 19, 2006
Sold by
Kf Ventures Ltd
Bought by
Clark Corbin W and Garcia Erica N
Home Financials for this Owner
Home Financials are based on the most recent Mortgage that was taken out on this home.
Original Mortgage
$158,900
Interest Rate
6.54%
Mortgage Type
Fannie Mae Freddie Mac
Create a Home Valuation Report for This Property
The Home Valuation Report is an in-depth analysis detailing your home's value as well as a comparison with similar homes in the area
Home Values in the Area
Average Home Value in this Area
Purchase History
| Date | Buyer | Sale Price | Title Company |
|---|---|---|---|
| Ellerbrock Cory M | $130,000 | Attorney | |
| Federal Home Loan Mortgage Corp | $106,000 | North American Title | |
| Garcia Erica N | $59,775 | Firelands Title | |
| Clark Corbin W | -- | First American Title Ins |
Source: Public Records
Mortgage History
| Date | Status | Borrower | Loan Amount |
|---|---|---|---|
| Open | Ellerbrock Sara E | $97,989 | |
| Closed | Ellerbrock Cory M | $129,298 | |
| Previous Owner | Garcia Erica N | $170,000 | |
| Previous Owner | Clark Corbin W | $158,900 |
Source: Public Records
Tax History Compared to Growth
Tax History
| Year | Tax Paid | Tax Assessment Tax Assessment Total Assessment is a certain percentage of the fair market value that is determined by local assessors to be the total taxable value of land and additions on the property. | Land | Improvement |
|---|---|---|---|---|
| 2024 | $2,399 | $61,010 | $10,360 | $50,650 |
| 2023 | $2,399 | $55,450 | $9,420 | $46,030 |
| 2022 | $2,311 | $55,450 | $9,420 | $46,030 |
| 2021 | $2,381 | $55,450 | $9,420 | $46,030 |
| 2020 | $2,233 | $51,070 | $9,420 | $41,650 |
| 2019 | $2,232 | $51,070 | $9,420 | $41,650 |
| 2018 | $2,063 | $51,070 | $9,420 | $41,650 |
| 2017 | $1,974 | $45,650 | $9,420 | $36,230 |
| 2016 | $1,732 | $45,650 | $9,420 | $36,230 |
| 2015 | $1,684 | $45,650 | $9,420 | $36,230 |
| 2014 | $1,603 | $41,620 | $9,520 | $32,100 |
| 2013 | $1,569 | $41,620 | $9,520 | $32,100 |
Source: Public Records
Map
Nearby Homes
- 18 Katlyn Dr
- 933 E Cole Rd
- 1832 Myrtle St
- 1970 Morrison Rd
- 1818 Finley Dr
- 350 Conner Dr
- 135 Briarwood Cir
- 41 Brookview Dr
- 64 River Run Dr Unit J
- 10 Meadowbrook Ln
- 10 Meadowbrook Dr
- 1420 Center St
- 905 Twinn St
- 1013 Whittlesey St
- 600 S Buchanan St
- 625 Bush Place
- 0 S Buchanan St
- 546 Oaklawn Ave
- 800 Lawndale Dr
- 815 South St