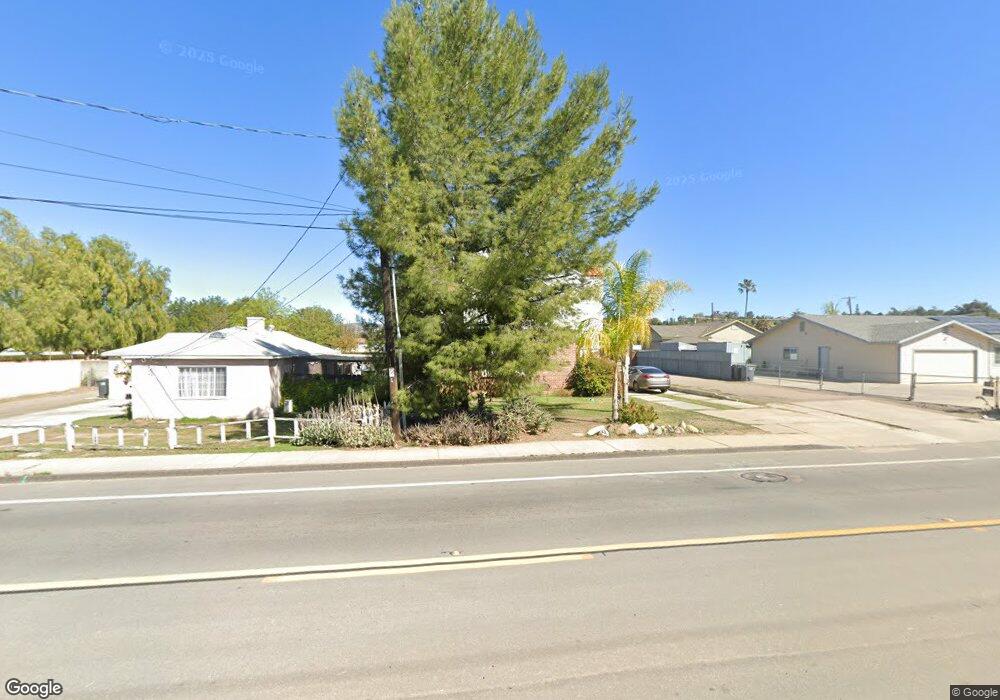
610 10th St Ramona, CA 92065
Estimated Value: $631,000 - $888,000
2
Beds
2
Baths
1,870
Sq Ft
$388/Sq Ft
Est. Value
About This Home
This home is located at 610 10th St, Ramona, CA 92065 and is currently estimated at $726,363, approximately $388 per square foot. 610 10th St is a home located in San Diego County with nearby schools including Ramona Elementary School, Olive Peirce Middle School, and Ramona High School.
Ownership History
Date
Name
Owned For
Owner Type
Purchase Details
Closed on
Jun 24, 2023
Sold by
Ljung Laureen
Bought by
Ljung Laureen and Cooper Franklin
Current Estimated Value
Purchase Details
Closed on
May 24, 2000
Sold by
County Of San Diego
Bought by
Cooper Thomas J
Home Financials for this Owner
Home Financials are based on the most recent Mortgage that was taken out on this home.
Original Mortgage
$51,450
Interest Rate
8.18%
Mortgage Type
Seller Take Back
Purchase Details
Closed on
May 29, 1998
Sold by
Jaramillo Jose I
Bought by
County Of San Diego
Purchase Details
Closed on
Feb 28, 1996
Sold by
Conrad Annick
Bought by
Jaramillo Jose I and Jaramillo Leticia
Home Financials for this Owner
Home Financials are based on the most recent Mortgage that was taken out on this home.
Original Mortgage
$97,597
Interest Rate
7.41%
Mortgage Type
FHA
Purchase Details
Closed on
Feb 26, 1990
Create a Home Valuation Report for This Property
The Home Valuation Report is an in-depth analysis detailing your home's value as well as a comparison with similar homes in the area
Home Values in the Area
Average Home Value in this Area
Purchase History
| Date | Buyer | Sale Price | Title Company |
|---|---|---|---|
| Ljung Laureen | -- | None Listed On Document | |
| Cooper Thomas J | $64,500 | -- | |
| County Of San Diego | -- | Lawyers Title | |
| Jaramillo Jose I | $98,000 | Fidelity National Title Co | |
| -- | $116,000 | -- |
Source: Public Records
Mortgage History
| Date | Status | Borrower | Loan Amount |
|---|---|---|---|
| Previous Owner | Cooper Thomas J | $51,450 | |
| Previous Owner | Jaramillo Jose I | $97,597 |
Source: Public Records
Tax History
| Year | Tax Paid | Tax Assessment Tax Assessment Total Assessment is a certain percentage of the fair market value that is determined by local assessors to be the total taxable value of land and additions on the property. | Land | Improvement |
|---|---|---|---|---|
| 2025 | $5,123 | $368,114 | $119,407 | $248,707 |
| 2024 | $5,123 | $360,897 | $117,066 | $243,831 |
| 2023 | $4,513 | $353,821 | $114,771 | $239,050 |
| 2022 | $4,683 | $346,884 | $112,521 | $234,363 |
| 2021 | $4,621 | $340,083 | $110,315 | $229,768 |
| 2020 | $4,585 | $336,597 | $109,184 | $227,413 |
| 2019 | $4,482 | $329,998 | $107,044 | $222,954 |
| 2018 | $4,370 | $323,529 | $104,946 | $218,583 |
| 2017 | $4,302 | $317,187 | $102,889 | $214,298 |
| 2016 | $4,203 | $310,969 | $100,872 | $210,097 |
| 2015 | $4,105 | $306,299 | $99,357 | $206,942 |
| 2014 | $3,988 | $300,300 | $97,411 | $202,889 |
Source: Public Records
Map
Nearby Homes
Your Personal Tour Guide
Ask me questions while you tour the home.