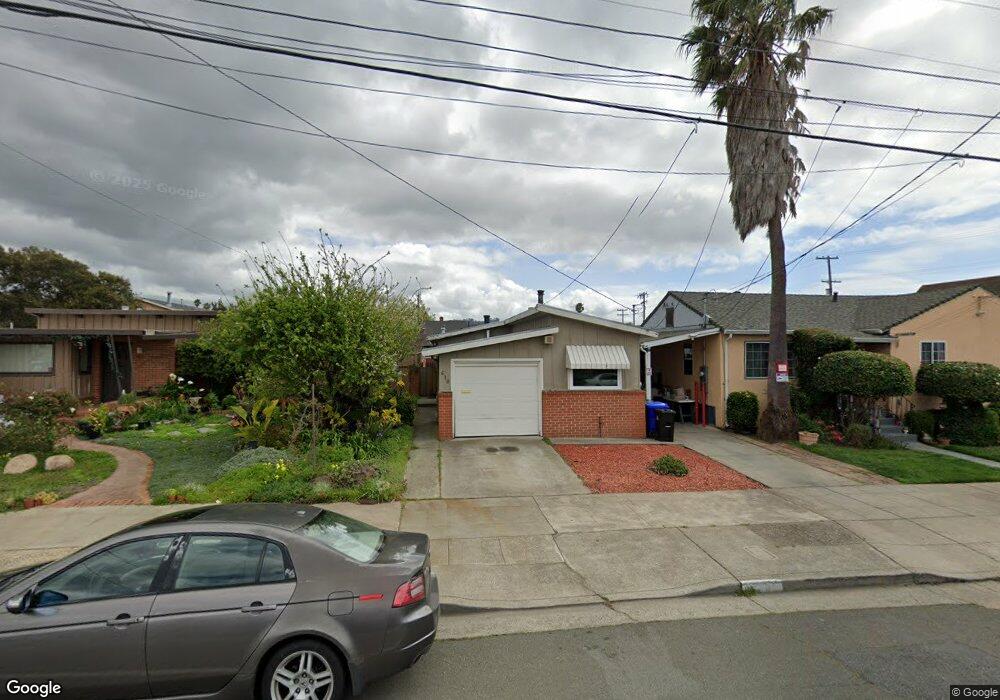
610 24th St Richmond, CA 94804
North & East NeighborhoodEstimated Value: $433,000 - $602,000
2
Beds
1
Bath
905
Sq Ft
$562/Sq Ft
Est. Value
About This Home
This home is located at 610 24th St, Richmond, CA 94804 and is currently estimated at $508,714, approximately $562 per square foot. 610 24th St is a home located in Contra Costa County with nearby schools including Michelle Obama School, Lovonya DeJean Middle School, and John F. Kennedy High School.
Ownership History
Date
Name
Owned For
Owner Type
Purchase Details
Closed on
Feb 22, 1999
Sold by
Ryan Thomas E
Bought by
Ford Carole M
Current Estimated Value
Home Financials for this Owner
Home Financials are based on the most recent Mortgage that was taken out on this home.
Original Mortgage
$117,319
Outstanding Balance
$27,864
Interest Rate
6.78%
Mortgage Type
FHA
Estimated Equity
$480,850
Create a Home Valuation Report for This Property
The Home Valuation Report is an in-depth analysis detailing your home's value as well as a comparison with similar homes in the area
Home Values in the Area
Average Home Value in this Area
Purchase History
| Date | Buyer | Sale Price | Title Company |
|---|---|---|---|
| Ford Carole M | $117,500 | First American Title Guarant |
Source: Public Records
Mortgage History
| Date | Status | Borrower | Loan Amount |
|---|---|---|---|
| Open | Ford Carole M | $117,319 | |
| Closed | Ford Carole M | $5,865 |
Source: Public Records
Tax History
| Year | Tax Paid | Tax Assessment Tax Assessment Total Assessment is a certain percentage of the fair market value that is determined by local assessors to be the total taxable value of land and additions on the property. | Land | Improvement |
|---|---|---|---|---|
| 2025 | $4,004 | $184,180 | $91,088 | $93,092 |
| 2024 | $3,895 | $180,569 | $89,302 | $91,267 |
| 2023 | $3,895 | $177,029 | $87,551 | $89,478 |
| 2022 | $3,794 | $173,559 | $85,835 | $87,724 |
| 2021 | $3,720 | $170,156 | $84,152 | $86,004 |
| 2019 | $3,482 | $165,111 | $81,657 | $83,454 |
| 2018 | $3,351 | $161,874 | $80,056 | $81,818 |
| 2017 | $3,257 | $158,701 | $78,487 | $80,214 |
| 2016 | $3,185 | $155,591 | $76,949 | $78,642 |
| 2015 | $3,144 | $153,255 | $75,794 | $77,461 |
| 2014 | $3,117 | $150,254 | $74,310 | $75,944 |
Source: Public Records
Map
Nearby Homes
- 559 Civic Center St
- 600 26th St Unit 606
- 2555 Barrett Ave
- 649 23rd St
- 2366 Gaynor Ave
- 444 28th St
- 653 20th St
- 2417 Esmond Ave
- 1827 Barrett Ave
- 569 18th St
- 0 Broadway
- 1929 Lincoln Ave
- 2103 Visalia Ave
- 3421 Roosevelt Ave
- 621 16th St
- 66 Murdock St
- 146 19th St
- 2110 Hellings Ave
- 2031 Chanslor Ave
- 2009 Coalinga Ave
Your Personal Tour Guide
Ask me questions while you tour the home.