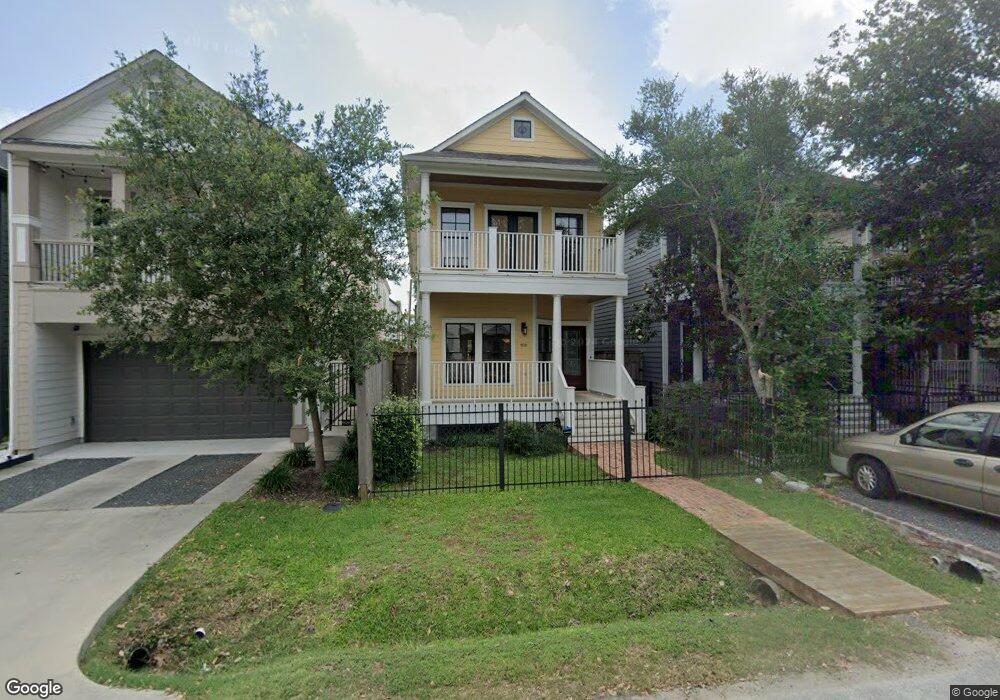
610 E 27th St Houston, TX 77008
Greater Heights NeighborhoodEstimated Value: $549,533 - $592,000
3
Beds
4
Baths
2,372
Sq Ft
$244/Sq Ft
Est. Value
About This Home
This home is located at 610 E 27th St, Houston, TX 77008 and is currently estimated at $578,633, approximately $243 per square foot. 610 E 27th St is a home located in Harris County with nearby schools including Field Elementary School, Hamilton Middle, and Heights High School.
Ownership History
Date
Name
Owned For
Owner Type
Purchase Details
Closed on
Nov 16, 2005
Sold by
Isbell Michael and Isbell Renee M
Bought by
Roan Philip F
Current Estimated Value
Home Financials for this Owner
Home Financials are based on the most recent Mortgage that was taken out on this home.
Original Mortgage
$194,400
Outstanding Balance
$105,733
Interest Rate
5.92%
Mortgage Type
Fannie Mae Freddie Mac
Estimated Equity
$472,900
Purchase Details
Closed on
Aug 17, 2000
Sold by
Tricon Designs Inc
Bought by
Isbell Michael P and Isbell Renee M
Home Financials for this Owner
Home Financials are based on the most recent Mortgage that was taken out on this home.
Original Mortgage
$246,050
Interest Rate
8.21%
Purchase Details
Closed on
Feb 25, 1999
Sold by
Berkson Bradley M and Berkson Michaela
Bought by
Anderson William G
Create a Home Valuation Report for This Property
The Home Valuation Report is an in-depth analysis detailing your home's value as well as a comparison with similar homes in the area
Home Values in the Area
Average Home Value in this Area
Purchase History
| Date | Buyer | Sale Price | Title Company |
|---|---|---|---|
| Roan Philip F | -- | -- | |
| Isbell Michael P | -- | Houston Title Co | |
| Anderson William G | -- | Fidelity National Title |
Source: Public Records
Mortgage History
| Date | Status | Borrower | Loan Amount |
|---|---|---|---|
| Open | Roan Philip F | $194,400 | |
| Previous Owner | Isbell Michael P | $246,050 |
Source: Public Records
Tax History
| Year | Tax Paid | Tax Assessment Tax Assessment Total Assessment is a certain percentage of the fair market value that is determined by local assessors to be the total taxable value of land and additions on the property. | Land | Improvement |
|---|---|---|---|---|
| 2025 | $7,463 | $538,633 | $240,000 | $298,633 |
| 2024 | $7,463 | $496,849 | $210,000 | $286,849 |
| 2023 | $7,463 | $556,688 | $210,000 | $346,688 |
| 2022 | $10,128 | $459,958 | $180,000 | $279,958 |
| 2021 | $9,882 | $424,000 | $180,000 | $244,000 |
| 2020 | $9,989 | $412,500 | $180,000 | $232,500 |
| 2019 | $9,489 | $375,000 | $150,000 | $225,000 |
| 2018 | $7,600 | $388,400 | $135,000 | $253,400 |
| 2017 | $10,428 | $412,399 | $156,000 | $256,399 |
| 2016 | $9,944 | $415,500 | $156,000 | $259,500 |
| 2015 | $6,539 | $397,662 | $135,000 | $262,662 |
| 2014 | $6,539 | $325,000 | $162,000 | $163,000 |
Source: Public Records
Map
Nearby Homes
Your Personal Tour Guide
Ask me questions while you tour the home.