Estimated Value: $691,000 - $1,880,000
2
Beds
2
Baths
9,999
Sq Ft
$103/Sq Ft
Est. Value
About This Home
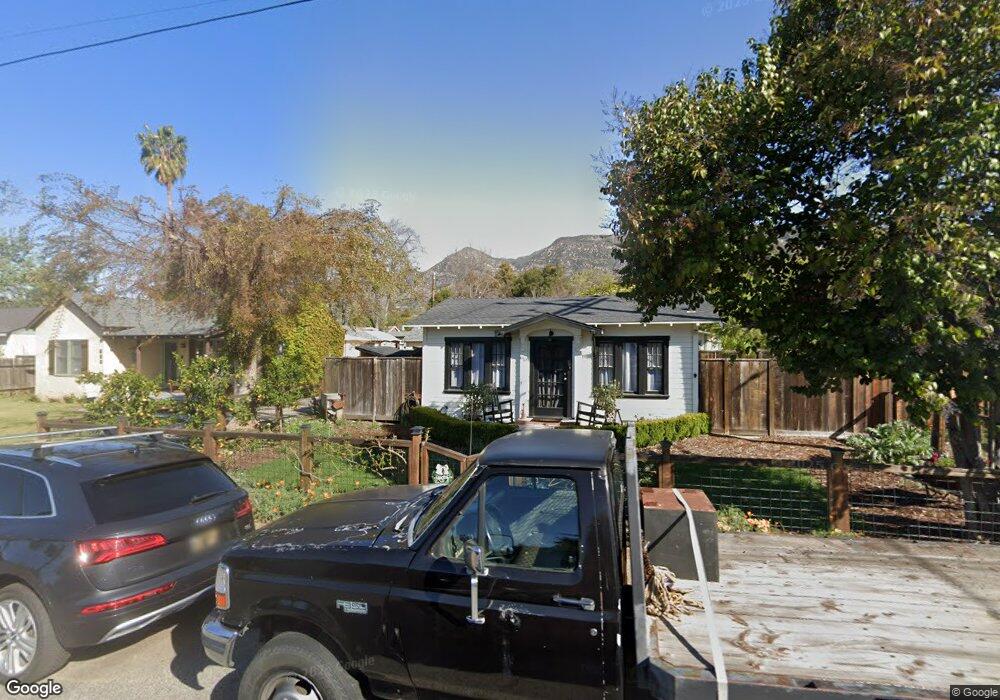
This home is located at 610 E Oak St, Ojai, CA 93023 and is currently estimated at $1,029,856, approximately $102 per square foot. 610 E Oak St is a home located in Ventura County with nearby schools including Topa Topa Elementary School, Meiners Oaks Elementary School, and Matilija Junior High.
Ownership History
Date
Name
Owned For
Owner Type
Purchase Details
Closed on
Jan 8, 2020
Sold by
Turner Tyler S and Turner Carrie L
Bought by
Switzer Jeffrey L and Switzer Debra L
Current Estimated Value
Purchase Details
Closed on
Mar 13, 2013
Sold by
Turner Tyler S and Turner Carrie L
Bought by
Turner Tyler S and Turner Carrie L
Purchase Details
Closed on
May 30, 2011
Sold by
Turner Tyler S and Turner Carrie L
Bought by
White Tyler S and Turner Carrie L
Purchase Details
Closed on
Mar 6, 2007
Sold by
Knight Barbara
Bought by
Switzer Jeffrey L and Switzer Debra L
Create a Home Valuation Report for This Property
The Home Valuation Report is an in-depth analysis detailing your home's value as well as a comparison with similar homes in the area
Home Values in the Area
Average Home Value in this Area
Purchase History
| Date | Buyer | Sale Price | Title Company |
|---|---|---|---|
| Switzer Jeffrey L | $305,000 | None Available | |
| Switzer Jeffrey L | -- | None Available | |
| Turner Tyler S | -- | None Available | |
| White Tyler S | -- | None Available | |
| Switzer Jeffrey L | $400,000 | Lawyers Title Company |
Source: Public Records
Tax History
| Year | Tax Paid | Tax Assessment Tax Assessment Total Assessment is a certain percentage of the fair market value that is determined by local assessors to be the total taxable value of land and additions on the property. | Land | Improvement |
|---|---|---|---|---|
| 2025 | $7,810 | $535,899 | $515,811 | $20,088 |
| 2024 | $7,810 | $525,392 | $505,697 | $19,695 |
| 2023 | $7,545 | $515,091 | $495,782 | $19,309 |
| 2022 | $7,482 | $504,992 | $486,061 | $18,931 |
| 2021 | $7,429 | $495,091 | $476,531 | $18,560 |
| 2020 | $7,256 | $490,017 | $471,646 | $18,371 |
| 2019 | $7,059 | $480,410 | $462,399 | $18,011 |
| 2018 | $6,982 | $470,991 | $453,333 | $17,658 |
| 2017 | $6,876 | $461,757 | $444,445 | $17,312 |
| 2016 | $5,500 | $368,000 | $353,000 | $15,000 |
| 2015 | $5,615 | $378,000 | $363,000 | $15,000 |
| 2014 | $5,215 | $362,000 | $348,000 | $14,000 |
Source: Public Records
Map
Nearby Homes
- 310 N Fulton St
- 201 Drown Ave
- 608 E Ojai Ave
- 915 E Matilija St
- 216 E Aliso St
- 207 E Eucalyptus St
- 211 Fox St
- 901 Grandview Ave
- 203 S Montgomery St
- 312 Fox St
- 1201 Grand Ave
- 0 N Ventura Unit TR25015633
- 0 E Ojai Ave Unit 224929
- 0 E Ojai Ave Unit V1-33149
- 1214 Gregory St
- 910 Mercer Ave
- 408 Canada St
- 127 Fairway Ln
- 1309 Gregory St
- 207 S Blanche St
Your Personal Tour Guide
Ask me questions while you tour the home.