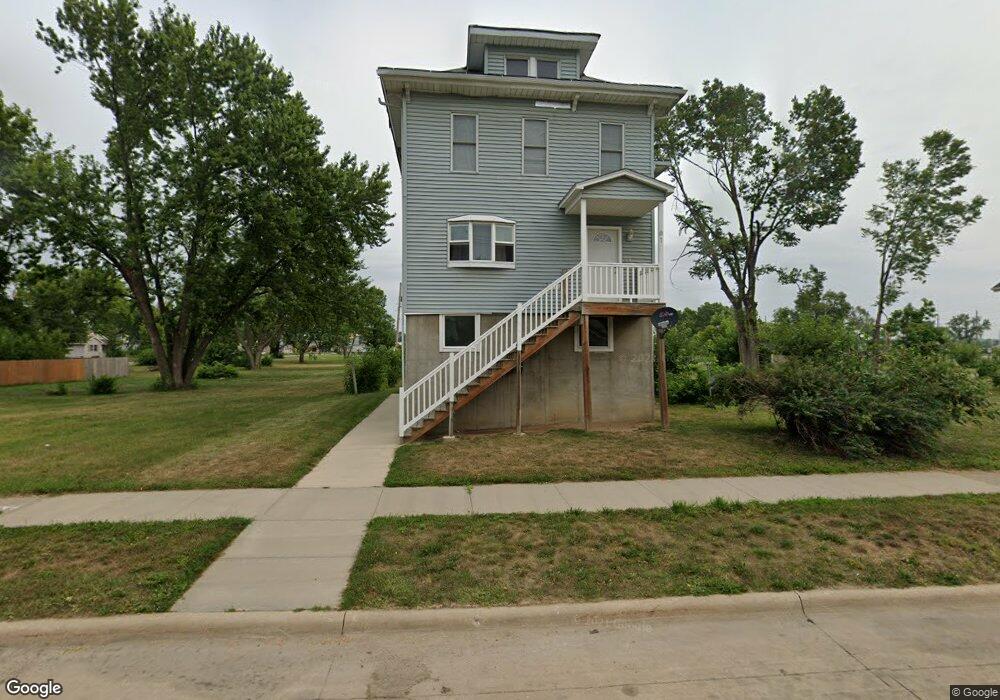
610 I Ave NW Cedar Rapids, IA 52405
Northwest Area NeighborhoodEstimated Value: $151,000 - $171,000
4
Beds
2
Baths
1,824
Sq Ft
$88/Sq Ft
Est. Value
About This Home
This home is located at 610 I Ave NW, Cedar Rapids, IA 52405 and is currently estimated at $161,000, approximately $88 per square foot. 610 I Ave NW is a home with nearby schools including Junction City Elementary School, Harrison Elementary School, and Kentucky Tech - Ashland Reg Tech Center.
Ownership History
Date
Name
Owned For
Owner Type
Purchase Details
Closed on
Feb 10, 2021
Sold by
Holmes Jennifer J and Holmes Jeremy J
Bought by
Holmes Jennifer J and Holmes Jeremy J
Current Estimated Value
Purchase Details
Closed on
Jul 26, 2004
Sold by
Federal National Mortgage Association
Bought by
Kingdom First Llc
Home Financials for this Owner
Home Financials are based on the most recent Mortgage that was taken out on this home.
Original Mortgage
$49,100
Outstanding Balance
$13,069
Interest Rate
6.08%
Mortgage Type
Unknown
Estimated Equity
$147,931
Create a Home Valuation Report for This Property
The Home Valuation Report is an in-depth analysis detailing your home's value as well as a comparison with similar homes in the area
Home Values in the Area
Average Home Value in this Area
Purchase History
| Date | Buyer | Sale Price | Title Company |
|---|---|---|---|
| Holmes Jennifer J | -- | None Available | |
| Kingdom First Llc | -- | -- |
Source: Public Records
Mortgage History
| Date | Status | Borrower | Loan Amount |
|---|---|---|---|
| Open | Kingdom First Llc | $49,100 |
Source: Public Records
Tax History Compared to Growth
Tax History
| Year | Tax Paid | Tax Assessment Tax Assessment Total Assessment is a certain percentage of the fair market value that is determined by local assessors to be the total taxable value of land and additions on the property. | Land | Improvement |
|---|---|---|---|---|
| 2025 | $2,210 | $117,500 | $26,700 | $90,800 |
| 2024 | $2,114 | $124,900 | $22,300 | $102,600 |
| 2023 | $2,114 | $124,900 | $22,300 | $102,600 |
| 2022 | $2,028 | $100,200 | $22,300 | $77,900 |
| 2021 | $2,220 | $97,900 | $20,000 | $77,900 |
| 2020 | $2,220 | $100,600 | $20,000 | $80,600 |
| 2019 | $1,998 | $92,700 | $15,600 | $77,100 |
| 2018 | $1,868 | $92,700 | $15,600 | $77,100 |
| 2017 | $1,868 | $95,900 | $15,600 | $80,300 |
| 2016 | $1,986 | $93,400 | $15,600 | $77,800 |
| 2015 | $2,018 | $94,829 | $15,593 | $79,236 |
| 2014 | $2,212 | $5,000 | $5,000 | $0 |
| 2013 | $261 | $5,000 | $5,000 | $0 |
Source: Public Records
Map
Nearby Homes
- 716 F Ave NW
- 718 4th St NW
- 819 G Ave NW
- 816 9th St NW
- 1222 8th St NW
- 1238 Ellis Blvd NW
- 714 East Ave NW
- 720 E Ave NW
- 1016 H Ave NW
- 820 M Ave NW
- 1073 G Ave NW
- 1126 13th St NW
- 1130 13th St NW
- 1015 Pawnee Dr NW
- 217 11th St NW
- 1020 A Ave NW
- 1424 N Ave NW
- 810 3rd Ave SW
- 100 4th Ave SW Unit 204
- 1311 Burch Ave NW