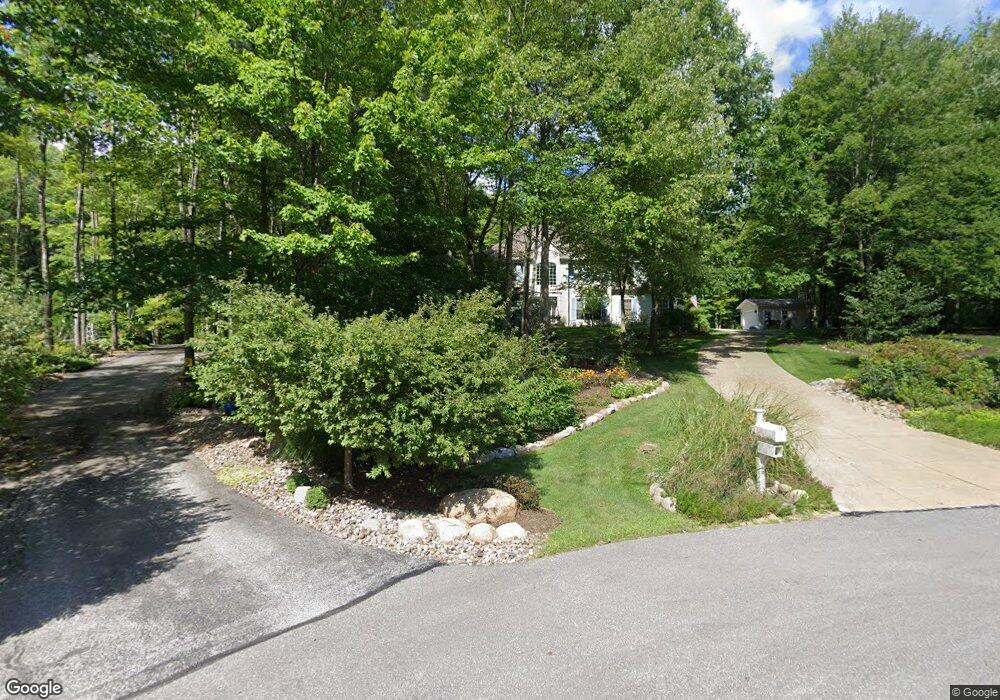
610 Lantern Way Aurora, OH 44202
Estimated Value: $576,692 - $643,000
4
Beds
3
Baths
2,860
Sq Ft
$212/Sq Ft
Est. Value
About This Home
This home is located at 610 Lantern Way, Aurora, OH 44202 and is currently estimated at $607,673, approximately $212 per square foot. 610 Lantern Way is a home located in Portage County with nearby schools including Miller Elementary School, Craddock/Miller Elementary School, and Leighton Elementary School.
Ownership History
Date
Name
Owned For
Owner Type
Purchase Details
Closed on
Dec 18, 2008
Sold by
Chapman Cherie
Bought by
Osorio Jesus and Osorio Shannon D
Current Estimated Value
Home Financials for this Owner
Home Financials are based on the most recent Mortgage that was taken out on this home.
Original Mortgage
$269,000
Outstanding Balance
$179,211
Interest Rate
6.3%
Mortgage Type
Purchase Money Mortgage
Estimated Equity
$428,462
Purchase Details
Closed on
Jun 19, 2007
Sold by
Shields Malcolm H and Shields Debbra F
Bought by
Chapman Cherie
Home Financials for this Owner
Home Financials are based on the most recent Mortgage that was taken out on this home.
Original Mortgage
$340,200
Interest Rate
10.25%
Mortgage Type
Purchase Money Mortgage
Purchase Details
Closed on
Mar 31, 1994
Bought by
Shields Malcolm H
Create a Home Valuation Report for This Property
The Home Valuation Report is an in-depth analysis detailing your home's value as well as a comparison with similar homes in the area
Home Values in the Area
Average Home Value in this Area
Purchase History
| Date | Buyer | Sale Price | Title Company |
|---|---|---|---|
| Osorio Jesus | $303,000 | Attorney | |
| Chapman Cherie | $378,000 | Real Living Title Agency Ltd | |
| Shields Malcolm H | $50,000 | -- |
Source: Public Records
Mortgage History
| Date | Status | Borrower | Loan Amount |
|---|---|---|---|
| Open | Osorio Jesus | $269,000 | |
| Previous Owner | Chapman Cherie | $340,200 |
Source: Public Records
Tax History Compared to Growth
Tax History
| Year | Tax Paid | Tax Assessment Tax Assessment Total Assessment is a certain percentage of the fair market value that is determined by local assessors to be the total taxable value of land and additions on the property. | Land | Improvement |
|---|---|---|---|---|
| 2024 | $8,134 | $181,830 | $25,130 | $156,700 |
| 2023 | $7,008 | $127,510 | $22,820 | $104,690 |
| 2022 | $6,347 | $127,510 | $22,820 | $104,690 |
| 2021 | $6,414 | $127,510 | $22,820 | $104,690 |
| 2020 | $6,207 | $115,470 | $22,820 | $92,650 |
| 2019 | $6,257 | $115,470 | $22,820 | $92,650 |
| 2018 | $6,442 | $108,330 | $22,820 | $85,510 |
| 2017 | $6,442 | $108,330 | $22,820 | $85,510 |
| 2016 | $5,806 | $108,330 | $22,820 | $85,510 |
| 2015 | $5,970 | $108,330 | $22,820 | $85,510 |
| 2014 | $5,655 | $100,560 | $22,820 | $77,740 |
| 2013 | $5,620 | $100,560 | $22,820 | $77,740 |
Source: Public Records
Map
Nearby Homes
- 831 Meadowbrook Dr
- 651 Parker Rd
- 190 Mill Run
- 8930 Crackel Rd
- 398 N Chillicothe Rd
- 85 Brighton Dr
- 818 Hilliary Ln
- 679 Deep Woods Dr
- 438 Club Dr
- 159 Royal Oak Dr
- 1130 Winchell Rd
- V/L Ohio 82
- 905 Club Dr W
- 913 Arthur Trail
- 580 Hardwick Dr
- 990 Whisperwood Ln
- 483 Townline Rd
- 405 Club Dr W
- 0 Aurora Hill Dr Unit 3956102
- 109 S Chillicothe Rd
- 645 Meadowbrook Dr
- 500 Duneden Dr
- 600 Lantern Way
- 665 Meadowbrook Dr
- 508 Duneden Dr
- 616 Lantern Way
- 613 Lantern Way
- 675 Meadowbrook Dr
- 591 Lantern Way
- 603 Lantern Way
- 505 Duneden Dr
- 495 Duneden Dr
- 0 Meadowbrook Dr
- 522 Duneden Dr
- 640 Meadowbrook Dr
- 525 Duneden Dr
- 565 Lantern Way
- 685 Meadowbrook Dr
- 660 Meadowbrook Dr
- 891 Meadowbrook Dr