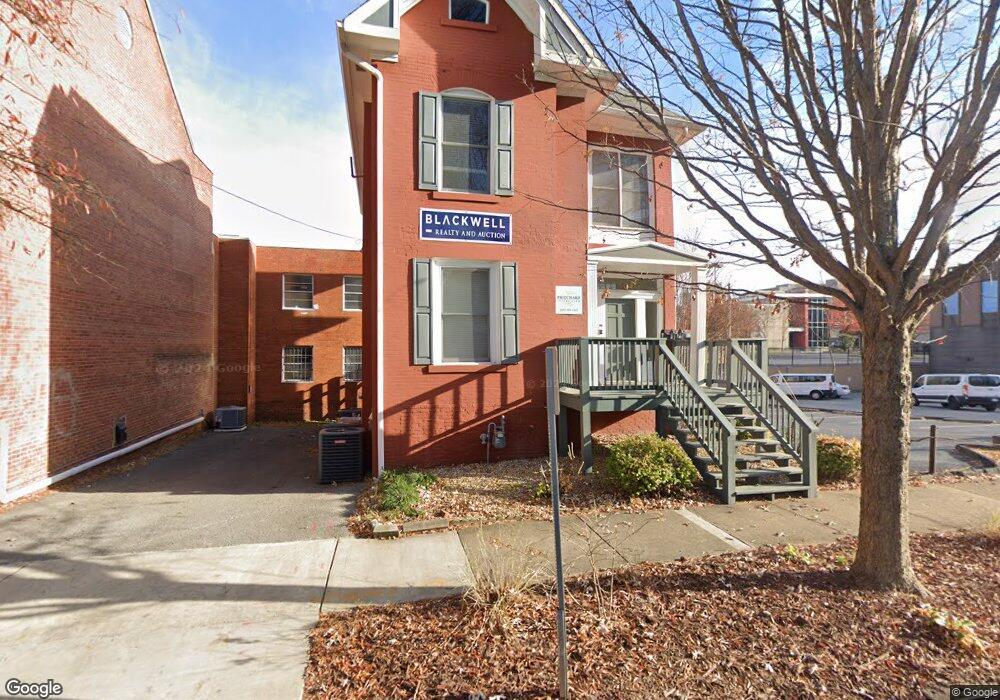
610 Lindsay St Unit C Chattanooga, TN 37403
Arts District NeighborhoodEstimated Value: $662,631
--
Bed
1
Bath
1,756
Sq Ft
$377/Sq Ft
Est. Value
About This Home
This home is located at 610 Lindsay St Unit C, Chattanooga, TN 37403 and is currently estimated at $662,631, approximately $377 per square foot. 610 Lindsay St Unit C is a home located in Hamilton County with nearby schools including Tommie F. Brown International Academy, IB World School, Orchard Knob Middle School, and The Howard School.
Ownership History
Date
Name
Owned For
Owner Type
Purchase Details
Closed on
Apr 4, 2022
Sold by
Prftex Properties Llc
Bought by
Blackwell John S
Current Estimated Value
Purchase Details
Closed on
Jan 9, 2020
Sold by
Boys And Girls Clubs Of Chattanooga Inc
Bought by
Pretex Properties Llc
Create a Home Valuation Report for This Property
The Home Valuation Report is an in-depth analysis detailing your home's value as well as a comparison with similar homes in the area
Home Values in the Area
Average Home Value in this Area
Purchase History
| Date | Buyer | Sale Price | Title Company |
|---|---|---|---|
| Blackwell John S | $585,000 | Tressler & Associates Pllc | |
| Pretex Properties Llc | $429,000 | Title Guaranty And Trust Co |
Source: Public Records
Tax History Compared to Growth
Tax History
| Year | Tax Paid | Tax Assessment Tax Assessment Total Assessment is a certain percentage of the fair market value that is determined by local assessors to be the total taxable value of land and additions on the property. | Land | Improvement |
|---|---|---|---|---|
| 2024 | $3,658 | $163,514 | $0 | $0 |
| 2023 | $3,658 | $163,514 | $0 | $0 |
| 2022 | $3,658 | $163,514 | $0 | $0 |
| 2021 | $3,658 | $163,514 | $0 | $0 |
| 2020 | $3,980 | $63,154 | $0 | $0 |
| 2019 | $1,746 | $63,154 | $0 | $0 |
| 2018 | $1,565 | $63,154 | $0 | $0 |
| 2017 | $1,746 | $63,154 | $0 | $0 |
| 2016 | $685 | $0 | $0 | $0 |
| 2015 | $1,373 | $24,786 | $0 | $0 |
| 2014 | $1,373 | $0 | $0 | $0 |
Source: Public Records
Map
Nearby Homes