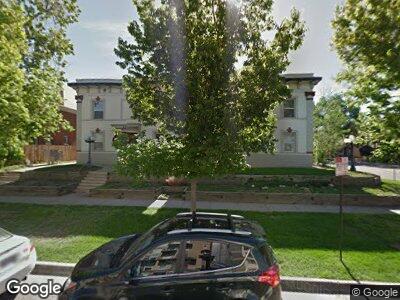
610 Logan St Unit 18 Denver, CO 80203
Alamo Placita NeighborhoodEstimated Value: $265,000 - $333,000
2
Beds
1
Bath
688
Sq Ft
$437/Sq Ft
Est. Value
About This Home
This home is located at 610 Logan St Unit 18, Denver, CO 80203 and is currently estimated at $300,620, approximately $436 per square foot. 610 Logan St Unit 18 is a home located in Denver County with nearby schools including Dora Moore ECE-8 School, Morey Middle School, and East High School.
Ownership History
Date
Name
Owned For
Owner Type
Purchase Details
Closed on
Nov 20, 2009
Sold by
Secretary Of Housing & Urban Development
Bought by
Chavez Gregory Allen
Current Estimated Value
Home Financials for this Owner
Home Financials are based on the most recent Mortgage that was taken out on this home.
Original Mortgage
$64,736
Outstanding Balance
$43,262
Interest Rate
4.99%
Mortgage Type
New Conventional
Estimated Equity
$266,309
Purchase Details
Closed on
Jul 17, 2009
Sold by
Rendon Jesse A
Bought by
Secretary Of Housing & Urban Development
Purchase Details
Closed on
Sep 28, 2000
Sold by
Carey Colette
Bought by
Rendon Jesse A
Home Financials for this Owner
Home Financials are based on the most recent Mortgage that was taken out on this home.
Original Mortgage
$122,850
Interest Rate
7.95%
Mortgage Type
FHA
Purchase Details
Closed on
Feb 13, 1998
Sold by
Damiao Partnership
Bought by
Carey Colette
Home Financials for this Owner
Home Financials are based on the most recent Mortgage that was taken out on this home.
Original Mortgage
$85,000
Interest Rate
6.92%
Create a Home Valuation Report for This Property
The Home Valuation Report is an in-depth analysis detailing your home's value as well as a comparison with similar homes in the area
Home Values in the Area
Average Home Value in this Area
Purchase History
| Date | Buyer | Sale Price | Title Company |
|---|---|---|---|
| Chavez Gregory Allen | $92,480 | Wtg | |
| Secretary Of Housing & Urban Development | -- | None Available | |
| Rendon Jesse A | $126,700 | -- | |
| Carey Colette | $89,500 | -- |
Source: Public Records
Mortgage History
| Date | Status | Borrower | Loan Amount |
|---|---|---|---|
| Open | Chavez Gregory Allen | $64,736 | |
| Previous Owner | Rendon Jesse A | $18,500 | |
| Previous Owner | Rendon Jesse A | $120,949 | |
| Previous Owner | Rendon Jesse A | $121,151 | |
| Previous Owner | Rendon Jesse A | $122,231 | |
| Previous Owner | Rendon Jesse A | $122,850 | |
| Previous Owner | Carey Colette | $85,000 |
Source: Public Records
Tax History Compared to Growth
Tax History
| Year | Tax Paid | Tax Assessment Tax Assessment Total Assessment is a certain percentage of the fair market value that is determined by local assessors to be the total taxable value of land and additions on the property. | Land | Improvement |
|---|---|---|---|---|
| 2024 | $1,527 | $19,280 | $1,690 | $17,590 |
| 2023 | $1,494 | $19,280 | $1,690 | $17,590 |
| 2022 | $1,622 | $20,390 | $5,570 | $14,820 |
| 2021 | $1,565 | $20,980 | $5,730 | $15,250 |
| 2020 | $1,604 | $21,620 | $5,730 | $15,890 |
| 2019 | $1,559 | $21,620 | $5,730 | $15,890 |
| 2018 | $1,368 | $17,680 | $4,040 | $13,640 |
| 2017 | $1,364 | $17,680 | $4,040 | $13,640 |
| 2016 | $1,213 | $14,870 | $3,829 | $11,041 |
| 2015 | $1,162 | $14,870 | $3,829 | $11,041 |
| 2014 | $767 | $9,230 | $4,012 | $5,218 |
Source: Public Records
Map
Nearby Homes
- 625 N Pennsylvania St Unit 208
- 625 N Pennsylvania St Unit 108
- 422 E 6th Ave
- 590 N Logan St Unit 303
- 590 N Logan St Unit 210
- 553 Logan St
- 537 Logan St
- 655 N Pearl St Unit 301
- 655 N Pearl St Unit 208
- 505 Logan St Unit 14
- 551 N Pearl St Unit 207
- 325 E 7th Ave
- 534 E 7th Ave Unit 107
- 534 E 7th Ave Unit 206
- 525 N Pearl St
- 414 E 5th Ave
- 669 N Washington St Unit 901
- 529 N Washington St Unit 304
- 611 E 7th Ave Unit 108
- 449 N Pearl St
- 610 Logan St Unit 19
- 610 Logan St Unit 18
- 610 Logan St Unit 17
- 610 Logan St Unit 16
- 610 Logan St Unit 15
- 610 Logan St Unit 14
- 610 Logan St Unit 12
- 610 Logan St Unit 11
- 610 Logan St Unit 10
- 610 Logan St Unit 9
- 610 Logan St Unit 8
- 610 Logan St Unit 7
- 610 Logan St Unit 6
- 610 Logan St Unit 5
- 610 Logan St Unit 4
- 610 Logan St Unit 3
- 610 Logan St Unit 2
- 610 Logan St Unit 1
- 610 N Logan St Unit 1
- 610 N Logan St Unit 19