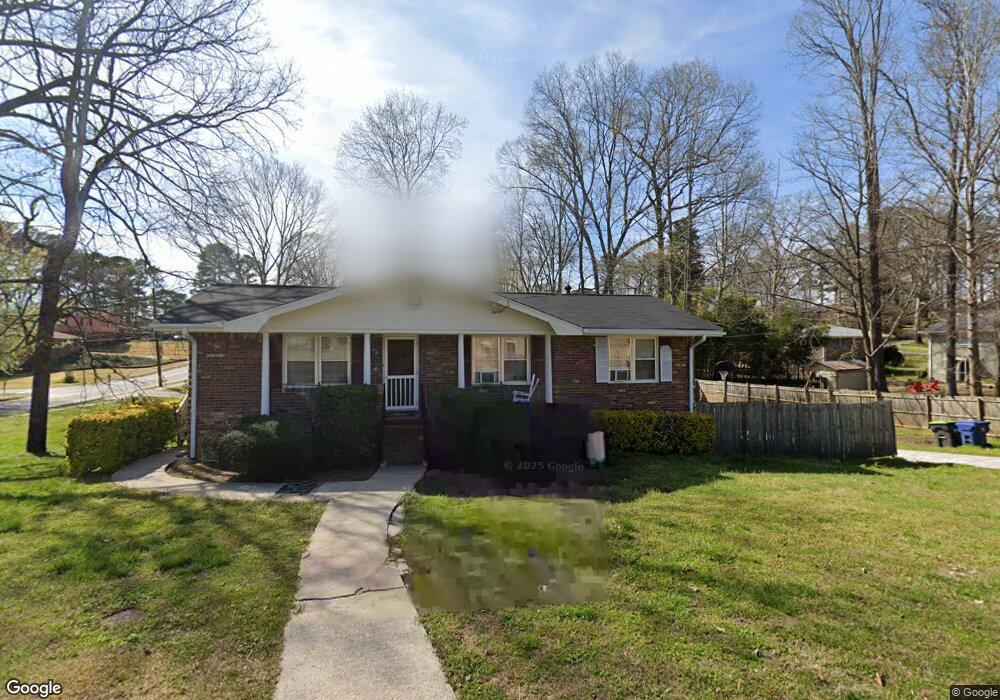
610 Norton Cir SE Unit 8 Smyrna, GA 30082
Estimated Value: $286,249 - $369,000
3
Beds
2
Baths
1,200
Sq Ft
$269/Sq Ft
Est. Value
About This Home
This home is located at 610 Norton Cir SE Unit 8, Smyrna, GA 30082 and is currently estimated at $322,562, approximately $268 per square foot. 610 Norton Cir SE Unit 8 is a home located in Cobb County with nearby schools including Norton Park Elementary School, Griffin Middle School, and Campbell High School.
Ownership History
Date
Name
Owned For
Owner Type
Purchase Details
Closed on
May 5, 2000
Sold by
Ogbuehi Ifeoma O
Bought by
Clark Brian K
Current Estimated Value
Home Financials for this Owner
Home Financials are based on the most recent Mortgage that was taken out on this home.
Original Mortgage
$103,744
Outstanding Balance
$35,466
Interest Rate
8.2%
Mortgage Type
FHA
Estimated Equity
$287,096
Purchase Details
Closed on
Apr 23, 1997
Sold by
Sinclair Samuel M
Bought by
Ogbuehi Ifeoma O
Home Financials for this Owner
Home Financials are based on the most recent Mortgage that was taken out on this home.
Original Mortgage
$84,918
Interest Rate
7.95%
Mortgage Type
FHA
Purchase Details
Closed on
Dec 30, 1993
Sold by
Holland Harvey Donald
Bought by
Sinclair Samuel M
Home Financials for this Owner
Home Financials are based on the most recent Mortgage that was taken out on this home.
Original Mortgage
$74,984
Interest Rate
7.19%
Create a Home Valuation Report for This Property
The Home Valuation Report is an in-depth analysis detailing your home's value as well as a comparison with similar homes in the area
Home Values in the Area
Average Home Value in this Area
Purchase History
| Date | Buyer | Sale Price | Title Company |
|---|---|---|---|
| Clark Brian K | $104,600 | -- | |
| Ogbuehi Ifeoma O | $86,900 | -- | |
| Sinclair Samuel M | $74,000 | -- |
Source: Public Records
Mortgage History
| Date | Status | Borrower | Loan Amount |
|---|---|---|---|
| Open | Clark Brian K | $103,744 | |
| Previous Owner | Ogbuehi Ifeoma O | $84,918 | |
| Previous Owner | Sinclair Samuel M | $74,984 |
Source: Public Records
Tax History Compared to Growth
Tax History
| Year | Tax Paid | Tax Assessment Tax Assessment Total Assessment is a certain percentage of the fair market value that is determined by local assessors to be the total taxable value of land and additions on the property. | Land | Improvement |
|---|---|---|---|---|
| 2025 | $737 | $120,000 | $36,000 | $84,000 |
| 2024 | $3,100 | $133,984 | $36,000 | $97,984 |
| 2023 | $1,113 | $67,408 | $18,400 | $49,008 |
| 2022 | $1,668 | $67,408 | $18,400 | $49,008 |
| 2021 | $2,036 | $84,260 | $18,400 | $65,860 |
| 2020 | $1,970 | $81,228 | $18,400 | $62,828 |
| 2019 | $1,587 | $63,732 | $18,400 | $45,332 |
| 2018 | $1,336 | $53,020 | $18,400 | $34,620 |
| 2017 | $1,268 | $53,020 | $18,400 | $34,620 |
| 2016 | $1,061 | $45,806 | $18,400 | $27,406 |
| 2015 | $1,089 | $45,806 | $18,400 | $27,406 |
| 2014 | $1,250 | $50,896 | $0 | $0 |
Source: Public Records
Map
Nearby Homes
- 571 Norton Cir SE
- 54 Church Rd SE Unit 1
- 3235 Woodview Dr SE
- 3175 Foxwood Trail SE
- 117 Radford Cir SW
- 3158 Autumn Brook Trail SE
- 260 Diane Dr SE
- 2975 Nursery Rd SE
- 358 Nature Brook Walk SE
- 259 Diane Dr SE
- 2898 Lakemont Dr SW
- 2896 Lakemont Dr SW
- 169 Hurt Dr SE
- 3418 Creek Valley Dr SE
- 3313 Hidden Trail Rd SE
- 166 Hurt Dr SE
- 0 Church Rd Unit 8706669
- 131 Church Rd SE
- 3001 Norton Ct SE
- 3011 Norton Ct SE Unit 8
- 3300 Foxwood Trail SE
- 119 Church Rd SE Unit 8
- 119 Church Rd SE
- 3021 Norton Ct SE
- 161 Church Rd SE
- 166 Church Rd SE Unit 1
- 109 Church Rd SE
- 120 Church Rd SE
- 3296 Foxwood Trail SE
- 580 Norton Cir SE
- 3031 Norton Ct SE
- 3167 Woodview Dr SE
- 0 Norton Ct SE Unit 7091707
- 0 Norton Ct SE Unit 8577669
- 0 Norton Ct SE Unit 8248524
- 0 Norton Ct SE Unit 7048510