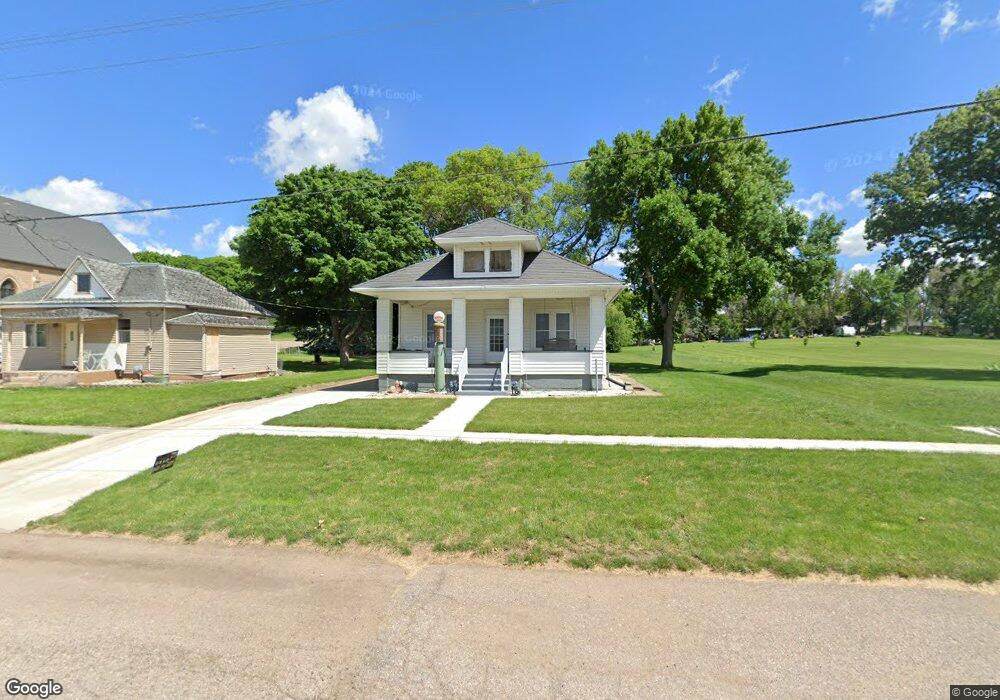
610 Peach St Danbury, IA 51019
Estimated Value: $78,060 - $143,000
3
Beds
3
Baths
1,160
Sq Ft
$90/Sq Ft
Est. Value
About This Home
This home is located at 610 Peach St, Danbury, IA 51019 and is currently estimated at $104,015, approximately $89 per square foot. 610 Peach St is a home located in Woodbury County with nearby schools including Mapleton Elementary School, Mvao Middle School, and Maple Valley-Anthon Oto High School.
Ownership History
Date
Name
Owned For
Owner Type
Purchase Details
Closed on
May 2, 2024
Sold by
Walnut Grove Investments Inc
Bought by
Iat 72 Llc
Current Estimated Value
Purchase Details
Closed on
Jun 12, 2014
Sold by
Mcnear Molly and Mcnear Mark A
Bought by
Mcnear Mark A
Create a Home Valuation Report for This Property
The Home Valuation Report is an in-depth analysis detailing your home's value as well as a comparison with similar homes in the area
Home Values in the Area
Average Home Value in this Area
Purchase History
| Date | Buyer | Sale Price | Title Company |
|---|---|---|---|
| Iat 72 Llc | -- | None Listed On Document | |
| Mcnear Mark A | -- | None Available |
Source: Public Records
Mortgage History
| Date | Status | Borrower | Loan Amount |
|---|---|---|---|
| Previous Owner | Mcnear Mark A | $25,000 | |
| Previous Owner | Mcnear Mark A | $10,000 | |
| Previous Owner | Mcnear Mark A | $45,000 |
Source: Public Records
Tax History Compared to Growth
Tax History
| Year | Tax Paid | Tax Assessment Tax Assessment Total Assessment is a certain percentage of the fair market value that is determined by local assessors to be the total taxable value of land and additions on the property. | Land | Improvement |
|---|---|---|---|---|
| 2025 | $620 | $59,700 | $5,410 | $54,290 |
| 2024 | $620 | $55,950 | $5,410 | $50,540 |
| 2023 | $690 | $55,950 | $5,410 | $50,540 |
| 2022 | $644 | $54,870 | $5,410 | $49,460 |
| 2021 | $644 | $54,870 | $5,410 | $49,460 |
| 2020 | $672 | $52,780 | $5,790 | $46,990 |
| 2019 | $682 | $52,780 | $5,790 | $46,990 |
| 2018 | $666 | $52,780 | $5,790 | $46,990 |
| 2017 | $666 | $52,780 | $5,790 | $46,990 |
| 2016 | $682 | $52,780 | $0 | $0 |
| 2015 | $762 | $49,330 | $5,410 | $43,920 |
| 2014 | $753 | $49,330 | $5,410 | $43,920 |
Source: Public Records
Map
Nearby Homes