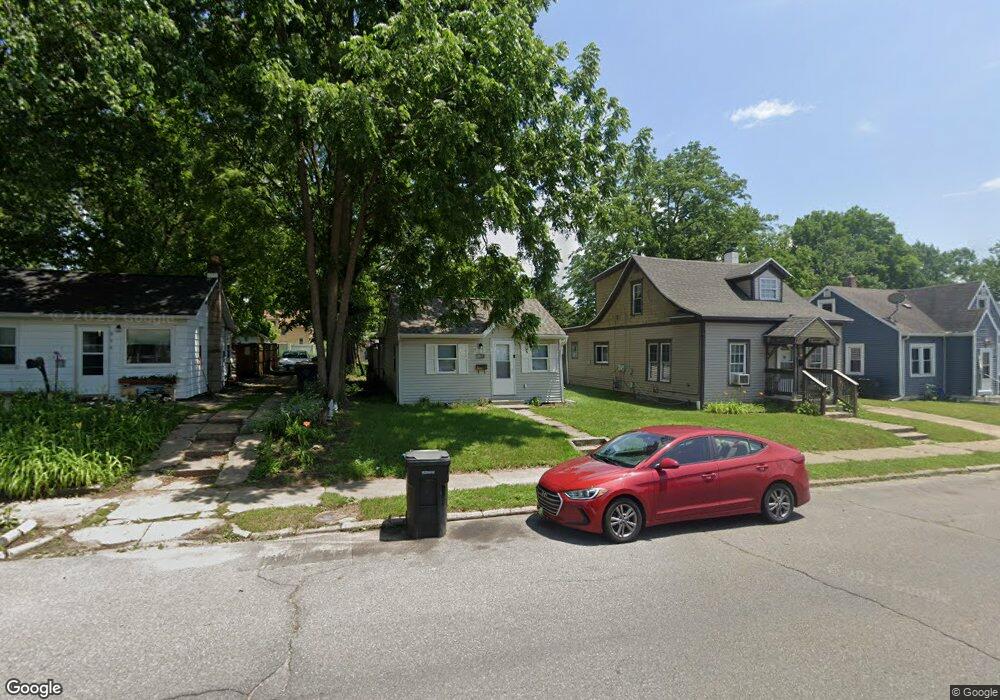
610 S 26th St South Bend, IN 46615
River Park NeighborhoodEstimated Value: $103,000 - $124,000
2
Beds
1
Bath
660
Sq Ft
$166/Sq Ft
Est. Value
About This Home
This home is located at 610 S 26th St, South Bend, IN 46615 and is currently estimated at $109,777, approximately $166 per square foot. 610 S 26th St is a home located in St. Joseph County with nearby schools including Cora B. Darling Elementary School, Nuner Fine Arts Academy, and Clay Intermediate Center.
Ownership History
Date
Name
Owned For
Owner Type
Purchase Details
Closed on
May 22, 2013
Sold by
Mfc South Bend Holdings Llc
Bought by
Mgc South Bend Holdings Ii Llc
Current Estimated Value
Purchase Details
Closed on
Nov 14, 2012
Sold by
Glickman Adam
Bought by
Mfc South Bend Holdings Llc
Purchase Details
Closed on
Feb 5, 2008
Sold by
Wells Fargo Bank Na
Bought by
Hsbc Bank Usa
Purchase Details
Closed on
Dec 14, 2006
Sold by
Oswalt Richard P
Bought by
Wells Fargo Bank Na
Purchase Details
Closed on
Jul 7, 2005
Sold by
Lee Barbara L
Bought by
Oswalt Richard P
Home Financials for this Owner
Home Financials are based on the most recent Mortgage that was taken out on this home.
Original Mortgage
$45,520
Interest Rate
7.75%
Mortgage Type
Adjustable Rate Mortgage/ARM
Create a Home Valuation Report for This Property
The Home Valuation Report is an in-depth analysis detailing your home's value as well as a comparison with similar homes in the area
Home Values in the Area
Average Home Value in this Area
Purchase History
| Date | Buyer | Sale Price | Title Company |
|---|---|---|---|
| Mgc South Bend Holdings Ii Llc | -- | Lawyers Title | |
| Mfc South Bend Holdings Llc | -- | Lawyers Title | |
| Hsbc Bank Usa | -- | None Available | |
| Wells Fargo Bank Na | $53,042 | None Available | |
| Oswalt Richard P | -- | Metroplitan Title In Llc |
Source: Public Records
Mortgage History
| Date | Status | Borrower | Loan Amount |
|---|---|---|---|
| Previous Owner | Oswalt Richard P | $45,520 |
Source: Public Records
Tax History Compared to Growth
Tax History
| Year | Tax Paid | Tax Assessment Tax Assessment Total Assessment is a certain percentage of the fair market value that is determined by local assessors to be the total taxable value of land and additions on the property. | Land | Improvement |
|---|---|---|---|---|
| 2024 | $1,697 | $72,600 | $5,600 | $67,000 |
| 2023 | $1,374 | $68,900 | $5,600 | $63,300 |
| 2022 | $1,374 | $56,800 | $5,600 | $51,200 |
| 2021 | $1,270 | $50,700 | $3,600 | $47,100 |
| 2020 | $923 | $36,300 | $3,100 | $33,200 |
| 2019 | $693 | $32,100 | $2,500 | $29,600 |
| 2018 | $708 | $27,500 | $2,100 | $25,400 |
| 2017 | $722 | $27,300 | $2,100 | $25,200 |
| 2016 | $739 | $27,400 | $2,100 | $25,300 |
| 2014 | $917 | $35,100 | $2,100 | $33,000 |
Source: Public Records
Map
Nearby Homes
- 634 S 26th St
- 537 S 27th St
- 610 S 27th St
- 513 S 26th St
- 525 S 28th St
- 806 S 26th St
- 510 S Ironwood Dr
- 1111 S 27th St
- 1017 S 23rd St
- 734 S 33rd St
- 3312 E Jefferson Square
- 2001 E Jefferson Blvd
- 3312 Mishawaka Ave
- 715 S 35th St
- 1105 S 35th St
- 930 S 34th St
- 741 S 36th St
- 110 S 33rd St
- 3517 Mishawaka Ave
- 222 N Tuxedo Dr