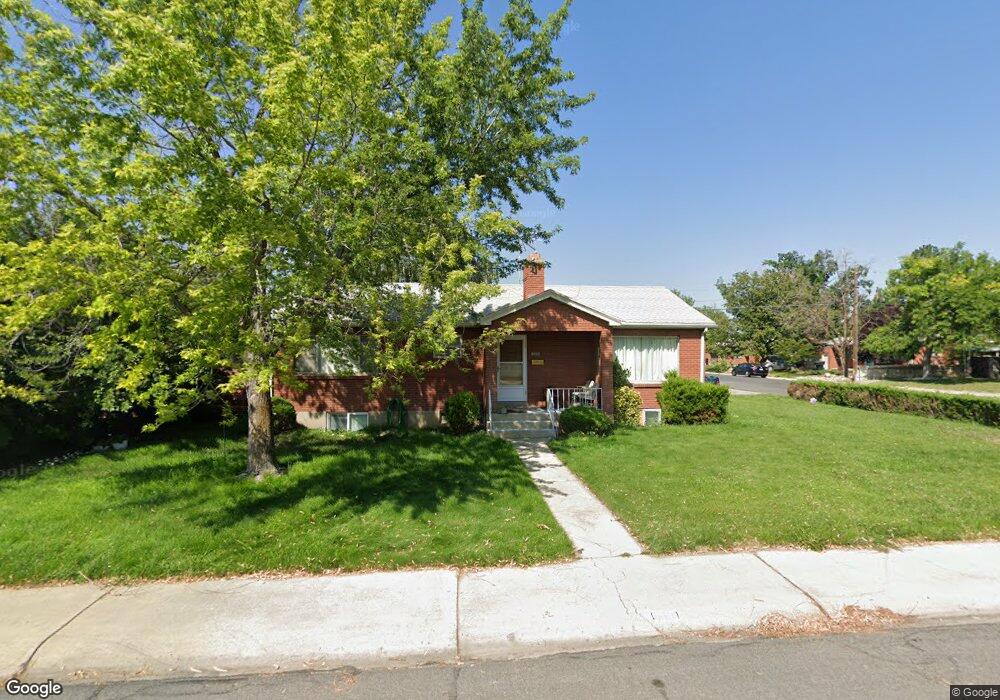
610 S 560 E Orem, UT 84097
SCERA NeighborhoodEstimated Value: $497,000 - $531,000
3
Beds
2
Baths
1,416
Sq Ft
$360/Sq Ft
Est. Value
About This Home
This home is located at 610 S 560 E, Orem, UT 84097 and is currently estimated at $510,268, approximately $360 per square foot. 610 S 560 E is a home located in Utah County with nearby schools including Centennial Elementary, Lakeridge Jr High School, and Orem High School.
Ownership History
Date
Name
Owned For
Owner Type
Purchase Details
Closed on
Nov 3, 2017
Sold by
Olsen Siolas H and Olsen Randal B
Bought by
Olsen Silas H and Olsen Randall B
Current Estimated Value
Purchase Details
Closed on
Oct 19, 2016
Sold by
Colyer David A and Colyer Kenneth C
Bought by
Olsen Silas H and Olsen Randall B
Home Financials for this Owner
Home Financials are based on the most recent Mortgage that was taken out on this home.
Original Mortgage
$156,695
Outstanding Balance
$74,276
Interest Rate
3.75%
Mortgage Type
FHA
Estimated Equity
$435,992
Purchase Details
Closed on
Jan 30, 2003
Sold by
Colyar Delphia W and Delphia W Colyar Family Trust
Bought by
Colyar David A and Colyar Kenneth C
Purchase Details
Closed on
Jan 30, 2001
Sold by
Colyar Delphia W
Bought by
Colyar David A and Colyar Kenneth C
Create a Home Valuation Report for This Property
The Home Valuation Report is an in-depth analysis detailing your home's value as well as a comparison with similar homes in the area
Home Values in the Area
Average Home Value in this Area
Purchase History
| Date | Buyer | Sale Price | Title Company |
|---|---|---|---|
| Olsen Silas H | -- | First American Title | |
| Olsen Silas H | -- | First American | |
| Colyar David A | -- | -- | |
| Colyar David A | -- | -- |
Source: Public Records
Mortgage History
| Date | Status | Borrower | Loan Amount |
|---|---|---|---|
| Open | Olsen Silas H | $156,695 |
Source: Public Records
Tax History
| Year | Tax Paid | Tax Assessment Tax Assessment Total Assessment is a certain percentage of the fair market value that is determined by local assessors to be the total taxable value of land and additions on the property. | Land | Improvement |
|---|---|---|---|---|
| 2025 | $1,781 | $234,410 | -- | -- |
| 2024 | $1,781 | $217,745 | $0 | $0 |
| 2023 | $1,635 | $214,830 | $0 | $0 |
| 2022 | $1,734 | $220,825 | $0 | $0 |
| 2021 | $1,614 | $311,200 | $131,600 | $179,600 |
| 2020 | $1,485 | $281,400 | $105,300 | $176,100 |
| 2019 | $1,329 | $261,900 | $98,300 | $163,600 |
| 2018 | $1,259 | $237,000 | $94,700 | $142,300 |
| 2017 | $1,178 | $118,855 | $0 | $0 |
| 2016 | $1,119 | $104,115 | $0 | $0 |
| 2015 | $1,143 | $100,540 | $0 | $0 |
| 2014 | $1,105 | $96,745 | $0 | $0 |
Source: Public Records
Map
Nearby Homes
Your Personal Tour Guide
Ask me questions while you tour the home.